Answered step by step
Verified Expert Solution
Link Copied!

Question

1 Approved Answer

KPMG (1) Task One (3) 30-60mins (2) Task Two Helping companies understand their data (1-2hours (3) Task Three 30-60 mins (4) Task Four (1)

KPMG\ (1) Task One\ (3)

30-60mins

\ (2) Task Two\ Helping companies understand their data\ (1-2hours\ (3) Task Three\

30-60

mins\ (4)\ Task Four\ (1)

30-60mins

\ (5)\ Task Five\ 1-2hours\ Finish Line\ Achievements\ Why this is important (1)\ Task 2: Data Analytics\ Here is your task\ Business understanding\ First, you should read through the company background document to gain an understanding of the client, Wondermarket, their business challenges and their business processes. This should take 5-10 minutes.\ Exploratory data analysis\ After this, you should start exploring the dataset provided. This exercise is for you to gain an understanding of their data, how it relates to their business, the statistical properties of the dataset and for you to start formulating how you can use the dataset to address the clients expectations. You can use any tool that you prefer for this, including Excel, Python and R. Make use of visualisations and charts to support your understanding at this stage! This should take 1520 minutes.\ Problem solving\ Now you have a full understanding of the business and its data, it is now your job to extract insights from the data in order to address each of the 3 expectations from the client. In order to properly address each expectation, you may be required to aggregate or make calculations on the original datasets. To provide evidence of your insights, please make use of visualisations, calculations and metrics that you feel are appropriate. You can use any tool that you prefer for this, including Excel, Python and R. This should take 20-30 minutes.\ Presentation of results\ Finally, we need to present the insights back to the client in a clear, concise and relatable format. We would like vou to present vour insights in the form of an executive summarv slide. Use the\ (?)
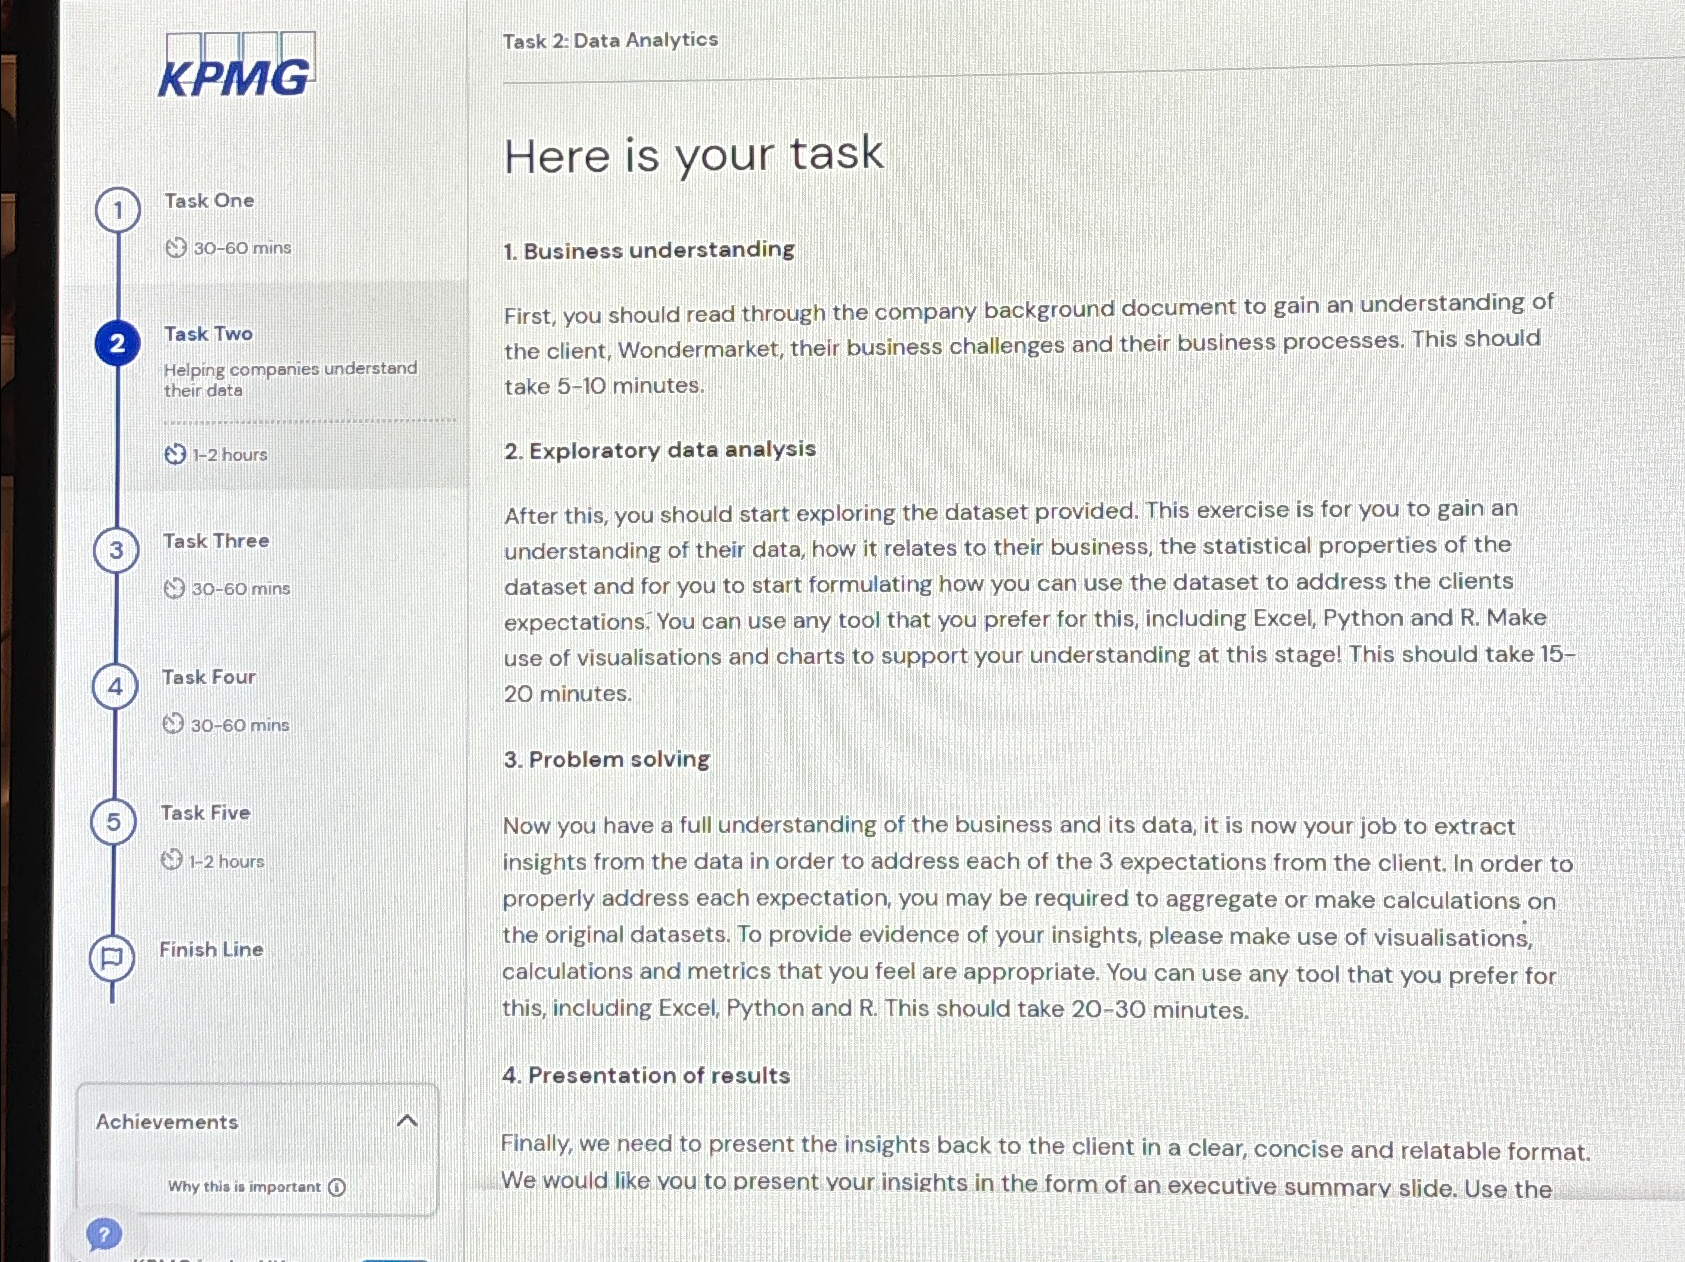
image text in transcribed
2. Exploratory data analysis After this, you should start exploring the dataset provided. This exercise is for you to gain an understanding of their data, how it relates to their business, the statistical properties of the dataset and for you to start formulating how you can use the dataset to address the clients expectations. You can use any tool that you prefer for this, including Excel, Python and R. Make use of visualisations and charts to support your understanding at this stage! This should take 1520 minutes. 3. Problem solving Now you have a full understanding of the business and its data, it is now your job to extract insights from the data in order to address each of the 3 expectations from the client. In order to properly address each expectation, you may be required to aggregate or make calculations on the original datasets. To provide evidence of your insights, please make use of visualisations, calculations and metrics that you feel are appropriate. You can use any tool that you prefer for this, including Excel, Python and R. This should take 20-30 minutes. 4. Presentation of results Finally, we need to present the insights back to the client in a clear, concise and relatable format. We would like vou to present your insights in the form of an executive summarv slide. Use the 2. Exploratory data analysis After this, you should start exploring the dataset provided. This exercise is for you to gain an understanding of their data, how it relates to their business, the statistical properties of the dataset and for you to start formulating how you can use the dataset to address the clients expectations. You can use any tool that you prefer for this, including Excel, Python and R. Make use of visualisations and charts to support your understanding at this stage! This should take 1520 minutes. 3. Problem solving Now you have a full understanding of the business and its data, it is now your job to extract insights from the data in order to address each of the 3 expectations from the client. In order to properly address each expectation, you may be required to aggregate or make calculations on the original datasets. To provide evidence of your insights, please make use of visualisations, calculations and metrics that you feel are appropriate. You can use any tool that you prefer for this, including Excel, Python and R. This should take 20-30 minutes. 4. Presentation of results Finally, we need to present the insights back to the client in a clear, concise and relatable format. We would like vou to present your insights in the form of an executive summarv slide. Use the

Step by Step Solution

There are 3 Steps involved in it

Step: 1

blur-text-image

Get Instant Access to Expert-Tailored Solutions

See step-by-step solutions with expert insights and AI powered tools for academic success

Step: 2

blur-text-image

Step: 3

blur-text-image

Ace Your Homework with AI

Get the answers you need in no time with our AI-driven, step-by-step assistance

Get Started

Recommended Textbook for

Database Concepts International Edition

Authors: David M. Kroenke

6th Edition International Edition

0133098222, 978-0133098228

More Books

Students also viewed these Databases questions