

Question: Lab 10 GUI, Data Manager and Data Elements Concepts tested by this program: NOTE: This lab requires attention to detail. Inheritance Follow the following instructions
Lab 10 GUI, Data Manager and Data Elements
Concepts tested by this program: NOTE: This lab requires attention to detail.
Inheritance Follow the following instructions carefully.
Interfaces
Polymorphism
Abstract classes
Overriding methods
Graphing with JavaFX
When computing limits, it is sometimes not obvious whether a limit exists simply by studying the function. Graphing the function and viewing it may sometimes help. In this lab, you will use and extend an application that graphs several functions. Refer to the Task #0 through Task #3 below for specific instructions.
Operation
When the user selects the Graph a Function button, the application will display a list of functions and ask the user to select one of them to plot.
The application will then ask the user for the left and right extents (i.e., between what values of x will the function be plotted), from which it will calculate the maximum and minimum values of the function that will be displayed.
Then the application will transform the function to the coordinate system of the display and plot it.
The user may then re-graph the same or a different function, or exit.
Specifications
Data Element the data elements are each value of x, from left extent to right extent, by increments of one pixel, and the corresponding values of f(x). The x and f(x) transformed into the display coordinate system are an additional data element.
Data Structure The abstract class Function holds an abstract method fnValue that is specific to each sub-class function, and an implemented function fnValueToPlot that uses fnValue to transform the values to the display coordinate system.
The following three functions have been implemented, each in a class that extends Function:

Each function has a toString() method that returns a description of the function, preceded by its index.
Data Manager the GraphManager class implements the methods of GraphManagerInterface. The GraphManager does not use any GUI methods.
The GraphManager selects the correct instance of the function based on the integer chosen. It implements its toString method by calling the function toString methods. It receives the user-selected extents of x (left and right) and the grid width in pixels and computes the extents of f(x) (minimum and maximum). To do this it computes values of f(x) over the extents of x from the left to the right extent in increments of one pixel (i goes from 1 to gridWidth) in order to determine the maximum and minimum extent of f(x)
Then the GraphManager uses the selected function instance and calls the functions method fnValueToPlot inherited from the Function class to compute the value of the function within the coordinate system of the panel. This value is returned to the GUI to be plotted.
GUI Driver
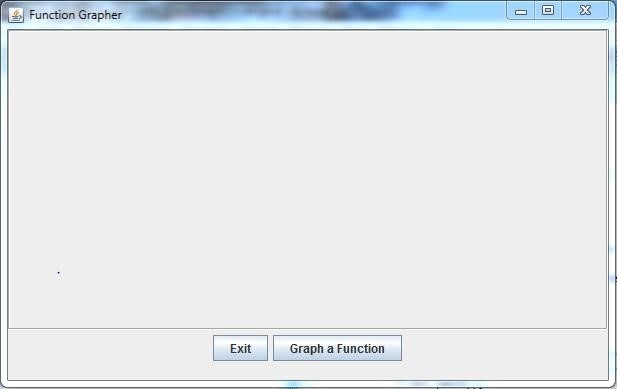
At start-up, a blank panel displays with an Exit Button and a Graph Function button.
The GUI creates and uses a GraphManager object.
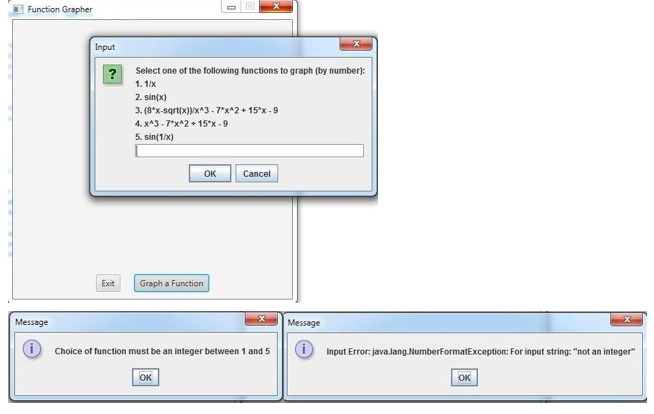
A JOptionPane is presented to prompt the user to choose one of the functions. The GraphManagers toString method is used to display the possible functions. If the user enters a non-integer, the exception will be caught and displayed, and will prompt for another entry. If the user enters an integer outside the range of 1 to 5, the user will be prompted for another entry until the user enters a valid integer. Once the user enters a valid integer, the GUI calls the GraphManagers setFunctionChoice method.
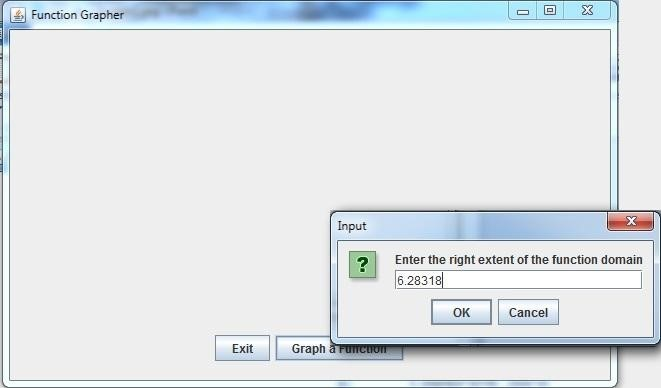
A JOptionPane is used to select the left and right extents of x (i.e., the minimum and maximum values of x). Exceptions will be thrown and caught if the user enters a non-number, error messages will be printed if an exception is thrown, and the user will be prompted for another entry until a valid number is entered. Once the user enters a valid number, the GUI calls the GraphManagers setExtents method to store the left and right extents and computes the maximum and minimum extents of the chosen function.
When the user selects the Graph a Function button and enters valid choices, the GUI calls the drawGraph() method. The Pane that holds the graphs is a Canvas class. Its method getGraphicsContext2D() is used to get an object with which to draw on the Canvas. For a GraphicsContext instance called gc, use the following method to draw a line segment between the two points (x1,y1) and (x0,y0).
gc.strokeLine(x0, y0, x1, y1);
The draw method iterates through each pixel from i=0 to i=gridWidth, and using the function instance retrieved from the GraphManager, calls the method fnValueToPlot inherited from the Function class to display the function within the coordinate system of the panel. It uses the above draw method to plot a line segment from x0=i to x1= i+1.
The user will be allowed to repeat the process for the same or another function.
TASK #0 Study the UML Class Diagram and the code.
Familiarize yourself with the code. Follow it from the class GraphDriverFX and its method start(), to MainPaneFX, to GraphPanelFX and GraphManager. Run it and observe its behavior. It will be incomplete when you first run it.
TASK #1 Implement the Line-drawing
When you first run the application, the graph will not be plotted, although the prompts will appear and be handled. In the method drawGraph(double, double, GraphicsContext), add a call to gc.strokeLine(x0Draw, y1Draw, x1Draw, y0Draw) to plot each line segment of the graph.
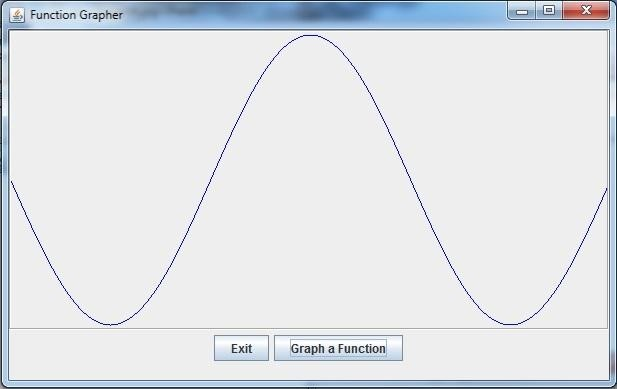
Experiment with all three functions provided, varying left and right extents. Notice the gray horizontal line that is plotted at y=0 for reference.
TASK #2 Add another function
Note that function #3 is a complicated, fairly unpredictable function. Run it with several extents, and note the singularities, where the graph goes to infinity. Then notice that the denominator of function #3 is just a cubic polynomial.
Implement the denominator of function #3 as function #4. Run function #4 to estimate where the function goes to zero, which will of course make function #3 undefined. Include in your writeup an estimate of the point or points at which function #4 goes to zero.
TASK #3 Add a fifth function
Very interesting behavior happens with the function f(x)=sin(1/x). Implement it, and run it with various extents. Include in your writeup what you think is happening with the function. At what value of x does the limit not exist?
Turn in the following:
The corrected java src directory in a compressed (zip or tar) file
A document with comments from Task #2 and #3
GraphDriverFX.Java
import javafx.application.Application; import javafx.scene.Scene; import javafx.scene.layout.BorderPane; import javafx.stage.Stage; public class GraphDriverFX extends Application { public final double CANVAS_WIDTH = 400; public final double CANVAS_HEIGHT = 300; public final double WINDOW_HEIGHT = 400; public static void main(String[] args){ launch(args); } /** * start is required by the class Application and is called by launch * It initializes MainPaneFX, which returns the main panel */ public void start(Stage stage) throws Exception { MainPaneFX mainPane = new MainPaneFX(CANVAS_WIDTH, CANVAS_HEIGHT); BorderPane root = mainPane.getMainPane(); Scene scene = new Scene(root, CANVAS_WIDTH, WINDOW_HEIGHT); stage.setScene(scene); stage.setTitle("Function Grapher"); stage.show(); } }
---------------------------------------------------------------
MainPaneFX.Java
import javax.swing.JOptionPane; import javafx.geometry.Insets; import javafx.geometry.Pos; import javafx.scene.Group; import javafx.scene.Parent; import javafx.scene.canvas.Canvas; import javafx.scene.canvas.GraphicsContext; import javafx.scene.control.Button; import javafx.scene.layout.BorderPane; import javafx.scene.layout.HBox; import javafx.scene.layout.StackPane; /** * This panel is the basic pane, inside which other panes are placed. * @author ralexander */ public class MainPaneFX { private BorderPane mainPane; private HBox buttonPanel; private GraphPanelFX graphPanel; private Canvas graphCanvas; private Button graphFunctionButton, exitButton; //The manager is the way the GUI communicates with the worker code private GraphManager graphManager; /** * The MainPanel constructor sets up the GUI with two buttons and a display area. */ MainPaneFX(double CANVAS_WIDTH, double CANVAS_HEIGHT) { mainPane = new BorderPane(); //create the dataManager instance graphManager = new GraphManager(); //create the exitButton exitButton = new Button("Exit"); //exitButton.setToolTipText("Exit the program"); exitButton.setOnAction(event -> System.exit(0) ); //create the button to start graphing graphFunctionButton = new Button("Graph a Function"); //graphFunctionButton.setToolTipText("Select a function and graph it"); /* * When the button pushed was the graph function button, user is prompted to select one of the functions, * and is asked for the left and right limits (extents) to plot the function. */ graphFunctionButton.setOnAction(event -> { graphCanvas.setVisible(false); int choice = 0; double left=0, right=0; choice = askForFunction("Select one of the following functions to graph (by number): "+graphManager.toString()); if(choice != 0) { graphManager.setFunctionChoice(choice); try { left = askForExtent("Enter the left extent of the function domain"); right = askForExtent("Enter the right extent of the function domain"); graphManager.setExtents(left, right, graphCanvas.getWidth()); graphPanel.drawGraph(); } catch (NullPointerException e) { JOptionPane.showMessageDialog(null, "No entry: exiting"); } graphCanvas.setVisible(true); } }); //create the buttonPanel buttonPanel = new HBox(); //buttonPanel.setPreferredSize(new Dimension(600,50)); buttonPanel.setVisible(true); buttonPanel.setAlignment(Pos.CENTER); HBox.setMargin(exitButton, new Insets(10,10,10,10)); HBox.setMargin(graphFunctionButton, new Insets(10,10,10,10)); buttonPanel.getChildren().addAll(exitButton, graphFunctionButton); //buttonPanel.add(graphFunctionButton); //add the panel to the bottom section of the main panel mainPane.setBottom(buttonPanel); //panel to hold the graph graphPanel = new GraphPanelFX(graphManager, CANVAS_WIDTH, CANVAS_HEIGHT); graphCanvas = graphPanel.getGraphCanvas(graphPanel); graphCanvas.setVisible(true); mainPane.setCenter(graphCanvas); } public GraphManager getGraphManager() { return graphManager; } private int askForFunction(String str) { boolean error=false; int returnVal=0; do { try { returnVal = Integer.parseInt(JOptionPane.showInputDialog (null, str)); if (returnVal5) { error = true; JOptionPane.showMessageDialog(null, "Choice of function must be an integer between 1 and 5"); } else error = false; } catch (NumberFormatException e) { JOptionPane.showMessageDialog(null, "Input Error: "+e); error = true; } } while(error); return returnVal; } private double askForExtent(String str) throws NullPointerException { boolean error=false; double returnVal=0; do { try { returnVal = Double.parseDouble(JOptionPane.showInputDialog(null, str)); error = false; } catch (NumberFormatException e) { JOptionPane.showMessageDialog(null, "Input Error - "+e); error = true; } } while(error); return returnVal; } public BorderPane getMainPane() { // TODO Auto-generated method stub return mainPane; } }
---------------------------------------------------------------
GraphPanelFX.Java
import javafx.scene.canvas.Canvas; import javafx.scene.canvas.GraphicsContext; import javafx.scene.paint.Paint; /** * GraphPanelFX creates the Canvas and draws the graph * @author ralexander * */ public class GraphPanelFX { double gridWidth; double gridHeight; double xLeft, xRight, yTop, yBottom; GraphManager graphMgr; Canvas graphCanvas; GraphicsContext gc; GraphPanelFX(GraphManager graphManager, double CANVAS_WIDTH, double CANVAS_HEIGHT) { graphMgr = graphManager; graphCanvas = new Canvas(CANVAS_WIDTH, CANVAS_HEIGHT); gc = graphCanvas.getGraphicsContext2D(); } public Canvas getGraphCanvas(GraphPanelFX graphPanel2) { return graphCanvas; } /** * drawGraph is called when the "Graph a Function" button is selected */ public void drawGraph() { gridWidth = gc.getCanvas().getWidth(); gridHeight = gc.getCanvas().getHeight(); gc.clearRect(0,0,gridWidth,gridHeight); System.out.println("in paintComponent(); width="+gridWidth+"; height="+gridHeight); drawGraph(gridWidth, gridHeight-10, gc); } /** * Draws line segments from left extent to right extent, pixel by pixel, transforming points * to the coordinate system of the panel. * @param gridWidth2 the width of the panel in pixels * @param gridHeight the height of the panel in pixels * @param g2 the Graphics2D instance generated by Java library classes and sent as a argument of paintComponent */ public void drawGraph(double gridWidth2, double gridHeight, GraphicsContext gc) { double x0=xLeft, y0, x1=0; double x1Draw, x0Draw, y1Draw, y0Draw; int functionChoice = graphMgr.getFunctionChoice(); Function fn = graphMgr.getFunction(functionChoice); //check to make sure a function choice has been made before drawing if(functionChoice>0) { xLeft = graphMgr.getLeftExtent(); xRight = graphMgr.getRightExtent(); graphMgr.setExtents(xLeft, xRight, gridWidth2); yTop = graphMgr.getTopExtent(); yBottom = graphMgr.getBottomExtent(); //draw a gray horizontal line at y=0 gc.setStroke(Paint.valueOf("Gray")); y1Draw = fn.originToPlot(gridHeight, yBottom, yTop); gc.strokeLine(0,y1Draw,gridWidth2,y1Draw); //set the graphing color and width gc.setStroke(Paint.valueOf("BLUE")); gc.setLineWidth(2); x0=xLeft; y0 = graphMgr.getFnValue(functionChoice, x0); //loop pixel by pixel, drawing the function between each value of x for (int i=1; i /** * The manager deals with the specified functions, i.e., selecting the function that the user wants, * setting the x-axis and y-axis extents that the user wants plotted, getting the function value at a * specified x, and getting the y value to be drawn on the GUI. * @author ralexander * */ public class GraphManager implements GraphManagerInterface { private double xLeft, xRight; private double yTop = Integer.MIN_VALUE; private double yBottom = Integer.MAX_VALUE; private int functionChoice=-999; Function function1, function2, function3, function4, function5, function6; /** * Constructor instantiates the functions specified. */ GraphManager() { function1 = new Function1(); function2 = new Function2(); function3 = new Function3(); } /** * getFnValue calculates the value of the function requested by the user, at a specific x value. * @param fnNum the choice of which function to evaluate * @param x the value at which to evaluate the function * @return the value of f(x) */ public double getFnValue (int fnNum, double x) { switch(fnNum) { case 1: return function1.fnValue(x); case 2: return function2.fnValue(x); case 3: return function3.fnValue(x); default: return 0; } } /** * Sets the function choice * @param choice an integer indexing the function desired */ public void setFunctionChoice(int choice) { functionChoice = choice; } /** * Gets the function index previously selected by the user * @return an index 1-4 corresponding to a function */ public int getFunctionChoice() { return functionChoice; } /** * Gets the actual function instance * @param choice the index of the function desired * @return an instance of a sub-class of the Function class */ public Function getFunction(int choice) { switch(choice) { case 1: return function1; case 2: return function2; case 3: return function3; default: return null; } } /** * Sets the left and right extents to be considered, and computes and sets the minimum and maximum * values of f(x) for those left-right extents. * @param xLeft user's desired left extent * @param xRight user's desired right extent * @param d width of the panel in pixels */ public void setExtents(double xLeft, double xRight, double d) { this.xLeft = xLeft; this.xRight = xRight; double x0=xLeft, x1=0, y1; Function fn = getFunction(functionChoice); yTop = Integer.MIN_VALUE; yBottom = Integer.MAX_VALUE; y1 = fn.fnValue(x0); if (y1>yTop && y1Integer.MIN_VALUE) yBottom=y1; for (int i=1; iyTop && y1Integer.MIN_VALUE) yBottom=y1; x0=x1; } System.out.println("xLeft = "+xLeft+"; xRight = "+xRight+" maxY = "+yTop+"; minY = "+yBottom+" gridWidth = "+d); } /** * Gets the left extent of the function to be considered * @return the x value of the left extent as a double */ public double getLeftExtent () { return xLeft; } /** * Gets the right extent of the function to be considered * @return the x value of the right extent as a double */ public double getRightExtent () { return xRight; } /** * Gets the top extent of the function to be considered * @return the maximum f(x) value that occurs from left to right */ public double getTopExtent () { return yTop; } /** * Gets the bottom extent of the function to be considered * @return the minimum f(x) value that occurs from left to right */ public double getBottomExtent () { return yBottom; } /** * Overrides toString, creating a string describing the functions' formulas */ public String toString() { String rtnString = ""; rtnString+="1. "+function1.toString()+" "; rtnString+="2. "+function2.toString()+" "; rtnString+="3. "+function3.toString()+" "; return rtnString; } }
--------------------------------------------------------------------
Function.Java
public abstract class Function { /** * Calculates the value f(x) of the function at x * @param x The x-value at which the function will be evaluated * @return a double, the value of the function at x */ public abstract double fnValue(double x); /** * Translates f(x) to the display coordinate system. Note that Java graphics * places (0,0) in the upper left, and (xmax, ymax) in the lower right of the * display. A buffer of 5 pixels is kept at top and bottom. * @param x the value at which f(x) will be evaluated * @param d the height in pixels of the display * @param minY the minimum f(x) to be displayed, over the extent of the x's * @param maxY the maximum f(x) to be displayed, over the extent of the x's * @return the value of f(x) translated to the display coordinate system */ public double fnValueToPlot(double x, double d, double minY, double maxY) { double y = fnValue(x); double yDraw = (d+5)-((y-minY)*(d/(maxY-minY))); return yDraw; } /** * Determines the display value where y=0 * @param height Height of the Canvas * @param minY th=0e minimum height of the function within the chosen extents * @param maxY the maximum height of the function within the chosen extents * @return the value of y to display corresponding to y */ public double originToPlot(double height, double minY, double maxY) { double yDraw = (height+5)-((0-minY)*(height/(maxY-minY))); return yDraw; } }
-----------------------------------------------------------
Function1.Java
public class Function1 extends Function {
@Override public double fnValue(double x) { if (x==0.0) return Double.MAX_VALUE; else return 1/x; } public String toString() { return "1/x"; } }
-----------------------------------
Function2.java
public class Function2 extends Function { @Override public double fnValue(double x) { return Math.sin(x); } public String toString() { return "sin(x)"; } }--------------------------------------------------
Function3.java
public class Function3 extends Function { @Override public double fnValue(double x) { return (8*x-Math.sqrt(x))/(Math.pow(x,3) - (7*Math.pow(x,2)) + 15*x - 9); } public String toString () { return "(8*x-sqrt(x))/x^3 - 7*x^2 + 15*x - 9"; } }
1 f1 (x) =- f2 (x) = sin x x3-7x2+15x-9 1 f1 (x) =- f2 (x) = sin x x3-7x2+15x-9
Step by Step Solution
There are 3 Steps involved in it

Get step-by-step solutions from verified subject matter experts