

Question
LabVIEW please! Create a VI that generates simulated temperature data in degrees Fahrenheit and converts the temperature to degrees Celcius. The temperature data should be
LabVIEW please!
Create a VI that generates simulated temperature data in degrees Fahrenheit and converts the temperature to degrees Celcius. The temperature data should be displayed on a waveform chart and on a digital thermometer on the front panel. Use a While Loop with a Conditional Terminal to stop the simuation. When the simulation ends, compute the average temperature and display the result using a digital indicator. Using a Property Node, provide the capability to configure the plot line color as blue or red as determined by an input on the front panel. The line color should be configurable programmatically while the VI is running (user can change this value while the program is running).
Also:
1. Add an enum control to the Front Panel that controls a property node on the Block diagram for the waveform chart. The property node will change the chart type displayed between the following choices: Strip, Scope, Sweep --use this control to update the chart type so that it is configurable programmatically
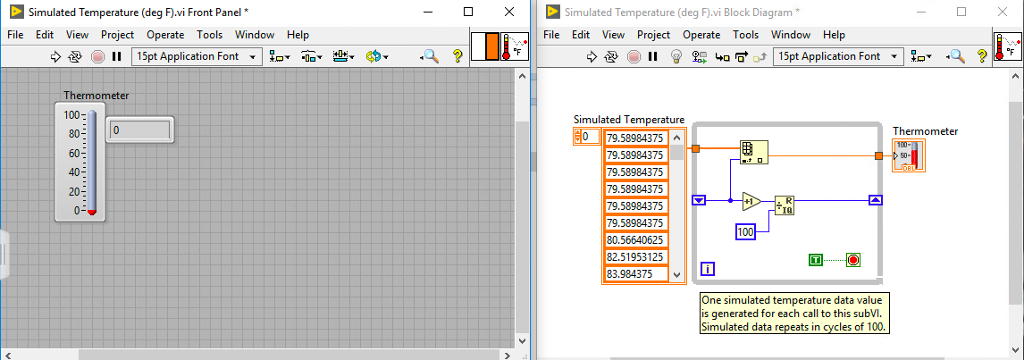
2. Use the "simulated temperature" VI (attached below) to generate your temperatures
Step by Step Solution
There are 3 Steps involved in it
Step: 1

Get Instant Access to Expert-Tailored Solutions
See step-by-step solutions with expert insights and AI powered tools for academic success
Step: 2

Step: 3
Ace Your Homework with AI
Get the answers you need in no time with our AI-driven, step-by-step assistance
Get Started
Essentials of Database Management
Authors: Jeffrey A. Hoffer, Heikki Topi, Ramesh Venkataraman
1st edition
133405680, 9780133547702 , 978-0133405682