

Answered step by step
Verified Expert Solution
Question
1 Approved Answer
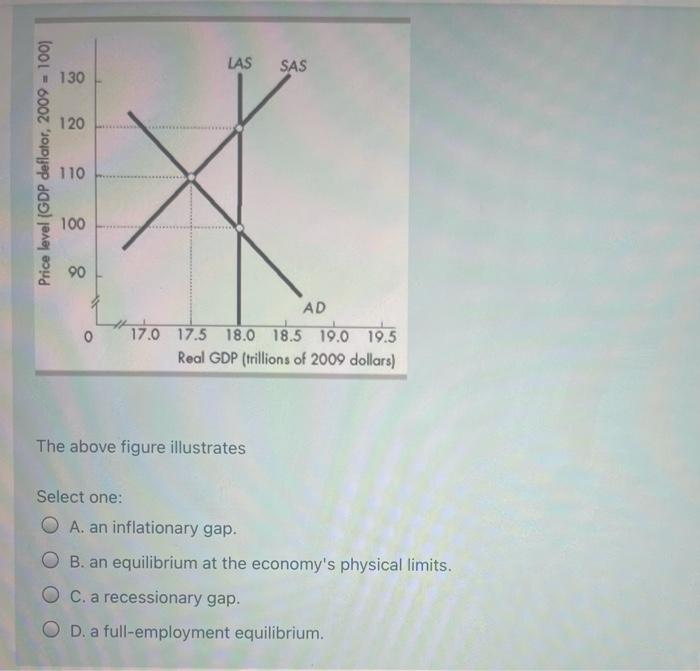
LAS SAS 130 120 Price level (GDP deflator, 2009 = 100) 110 X 100 90 O AD 17.0 17.5 18.0 18.5 19.0 19.5 Real GDP
Step by Step Solution
There are 3 Steps involved in it
Step: 1

Get Instant Access to Expert-Tailored Solutions
See step-by-step solutions with expert insights and AI powered tools for academic success
Step: 2

Step: 3
Ace Your Homework with AI
Get the answers you need in no time with our AI-driven, step-by-step assistance
Get Started
Principles Of Econometrics
Authors: R Hill
4th Edition
1118136969, 9781118136966