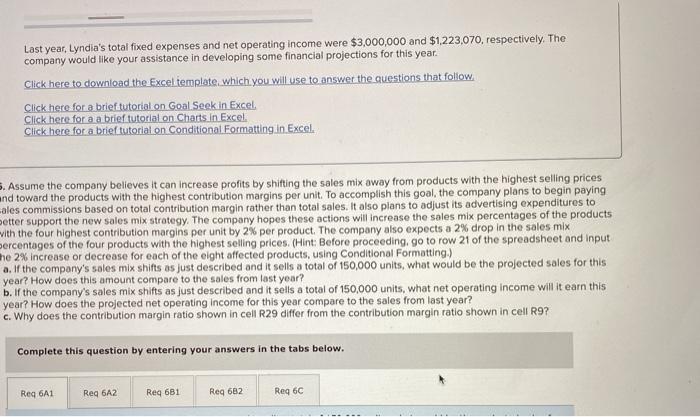
Last year, Lyndia's total fixed expenses and net operating income were $3,000,000 and $1,223,070, respectively. The company would like your assistance in developing some financial projections for this year. Click here to download the Excel template which you will use to answer the questions that follow Click here for a brief tutorial on Gool Seek in Excel Click here for a a brief tutorial on Charts in Excel. Click here for a brief tutorial on Conditional Formatting in Excel. 5. Assume the company believes it can increase profits by shifting the sales mix away from products with the highest selling prices and toward the products with the highest contribution margins per unit. To accomplish this goal, the company plans to begin paying cales commissions based on total contribution margin rather than total sales. It also plans to adjust its advertising expenditures to better support the new sales mix strategy. The company hopes these actions will increase the sales mix percentages of the products with the four highest contribution margins per unit by 2% per product. The company also expects a 2% drop in the sales mix percentages of the four products with the highest selling prices. (Hint: Before proceeding, go to row 21 of the spreadsheet and input the 2% increase or decrease for each of the eight offected products, using Conditional Formatting.) a. If the company's sales mix shifts as just described and it sells a total of 150,000 units, what would be the projected sales for this year? How does this amount compare to the sales from last year? b. If the company's sales mix shifts as just described and it sells a total of 150,000 units, what net operating income will it earn this year? How does the projected net operating Income for this year compare to the sales from last year? c. Why does the contribution margin ratio shown in cell R29 differ from the contribution margin ratio shown in cell R9? Complete this question by entering your answers in the tabs below. Req 6A1 Reg 6A2 Req 681 Reg 682 Req 6C Last year, Lyndia's total fixed expenses and net operating income were $3,000,000 and $1,223,070, respectively. The company would like your assistance in developing some financial projections for this year. Click here to download the Excel template which you will use to answer the questions that follow Click here for a brief tutorial on Gool Seek in Excel Click here for a a brief tutorial on Charts in Excel. Click here for a brief tutorial on Conditional Formatting in Excel. 5. Assume the company believes it can increase profits by shifting the sales mix away from products with the highest selling prices and toward the products with the highest contribution margins per unit. To accomplish this goal, the company plans to begin paying cales commissions based on total contribution margin rather than total sales. It also plans to adjust its advertising expenditures to better support the new sales mix strategy. The company hopes these actions will increase the sales mix percentages of the products with the four highest contribution margins per unit by 2% per product. The company also expects a 2% drop in the sales mix percentages of the four products with the highest selling prices. (Hint: Before proceeding, go to row 21 of the spreadsheet and input the 2% increase or decrease for each of the eight offected products, using Conditional Formatting.) a. If the company's sales mix shifts as just described and it sells a total of 150,000 units, what would be the projected sales for this year? How does this amount compare to the sales from last year? b. If the company's sales mix shifts as just described and it sells a total of 150,000 units, what net operating income will it earn this year? How does the projected net operating Income for this year compare to the sales from last year? c. Why does the contribution margin ratio shown in cell R29 differ from the contribution margin ratio shown in cell R9? Complete this question by entering your answers in the tabs below. Req 6A1 Reg 6A2 Req 681 Reg 682 Req 6C


