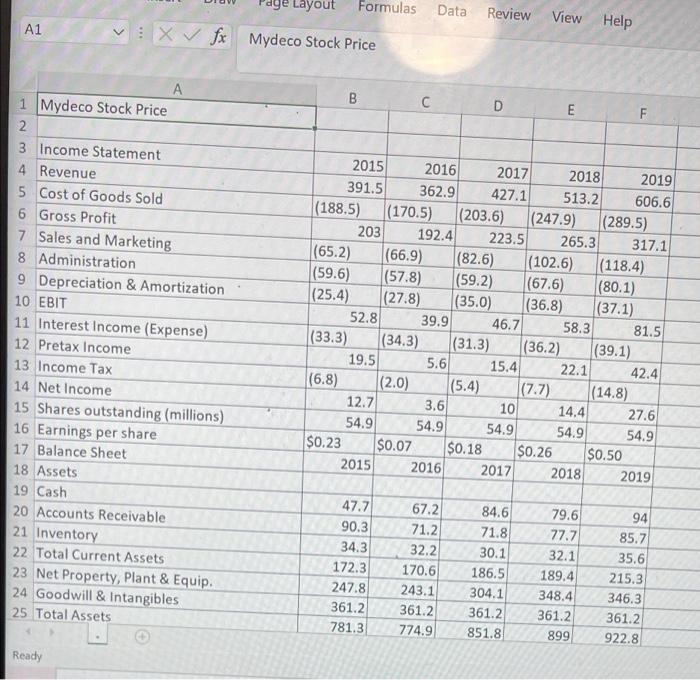
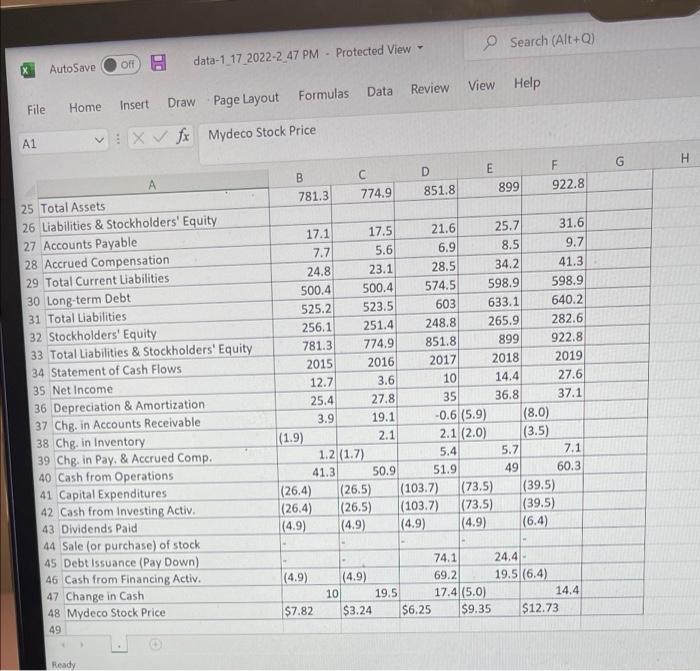
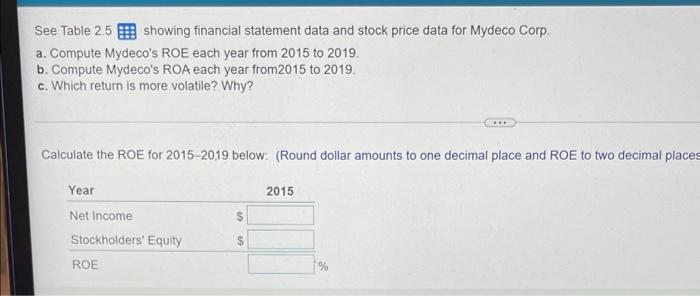
Layout Formulas Data Review View Help A1 X fx Mydeco Stock Price B D E A 1 Mydeco Stock Price 2 3 Income Statement 4 Revenue 5 Cost of Goods Sold 6 Gross Profit 7 Sales and Marketing 8 Administration 9 Depreciation & Amortization 10 EBIT 11 Interest Income (Expense) 12 Pretax Income 13 Income Tax 14 Net Income 15 Shares outstanding (millions) 16 Earnings per share 17 Balance Sheet 18 Assets 19 Cash 20 Accounts Receivable 21 Inventory 22 Total Current Assets 23 Net Property, Plant & Equip. 24 Goodwill & Intangibles 25 Total Assets 2015 2016 2017 2018 2019 391.5 362.9 427.1 513.2 606.6 (188,5) (170.5) (203.6) (247.9) (289.5) 203 192.4 223.5 265.3 317.1 (65.2) (66.9) (82.6) (102.6) (118.4) (59.6) (57.8) (59.2) (67.6) (80.1) (25.4) (27.8) (35.0) (36.8) (37.1) 52.8 39.9 46.7 58.3 81.5 (33.3) (34.3) (31.3) (36.2) (39.1) 19.5 5.6 15.4 22.1 42.4 (6.8) (2.0) (5.4) (7.7) (14.8) 12.7 3.6 10 14.4 27.6 54.9 54.9 54.9 54.9 54.9 $0.23 $0.07 $0.18 $0.26 $0.50 2015 2016 2017 2018 2019 47.7 90.3 34.3 172.3 247.8 361.2 781.3 67.2 71.2 32.2 170.6 243.1 361.2 774.9 84.6 71.8 30.1 186.5 304.1 361.2 851.8 79.6 77.7 32.1 189.4 348.4 361.2 899 94 85.7 35.6 215.3 346.3 361.2 922.8 Ready O Search (Alt+0) AutoSave Off data-1 17 2022-2_47 PM - Protected View Data Review View Help File Home Insert Draw Page Layout Formulas A1 VOX ft Mydeco Stock Price G H D B 781.3 E 899 F 922.8 774.9 851.8 25 Total Assets 26 Liabilities & Stockholders' Equity 27 Accounts Payable 28 Accrued Compensation 29 Total Current Liabilities 30 Long-term Debt 31 Total Liabilities 32 Stockholders' Equity 33 Total Liabilities & Stockholders' Equity 34 Statement of Cash Flows 35 Net Income 36 Depreciation & Amortization 37 Chg. in Accounts Receivable 38 Chg. in Inventory 39 Chg. in Pay. & Accrued Comp. 40 Cash from Operations 41 Capital Expenditures 42 Cash from Investing Activ 43 Dividends Paid 44 Sale (or purchase) of stock 45 Debt Issuance (Pay Down) 46 Cash from Financing Activ. 47 Change in Cash 48 Mydeco Stock Price 49 17.1 17.5 21.6 25.7 31.6 7.7 5.6 6.9 8.5 9.7 24.8 23.1 28.5 34.2 41.3 500.4 500.4 574.5 598.9 598.9 525.2 523.5 603 633.1 640.2 256.1 251.4 248.8 265.9 282.6 781.3 774.9 851.8 899 922.8 2015 2016 2017 2018 2019 12.7 3.6 10 14.4 27.6 25.4 27.8 35 36.8 37.1 3.9 19.1 -0.6 (5.9) (8.0) (1.9) 2.1 2.1 (2.0) (3.5) 1.2 (1.7) 5.4 5.7 7.1 41.3 50.9 51.9 49 60.3 (26.4) (26.5) (103.7) (73.5) (39.5) (26.4) (26.5) (103.7) (73.5) (39.5) (4.9) (4.9) (4.9) (4.9) (6.4) (4.9) 74.1 24,4 - (4.9) 69.2 19.5 (6.4) 10 19.5 17.4(5.0) 14.4 $3.24 $6.25 $9.35 $12.73 $7.82 Ready See Table 2.5 B showing financial statement data and stock price data for Mydeco Corp. a. Compute Mydeco's ROE each year from 2015 to 2019. b. Compute Mydeco's ROA each year from 2015 to 2019. C. Which return is more volatile? Why? Calculate the ROE for 2015-2019 below: (Round dollar amounts to one decimal place and ROE to two decimal places 2015 Year Net Income Stockholders' Equity $ S ROE %