

Answered step by step
Verified Expert Solution
Question
1 Approved Answer
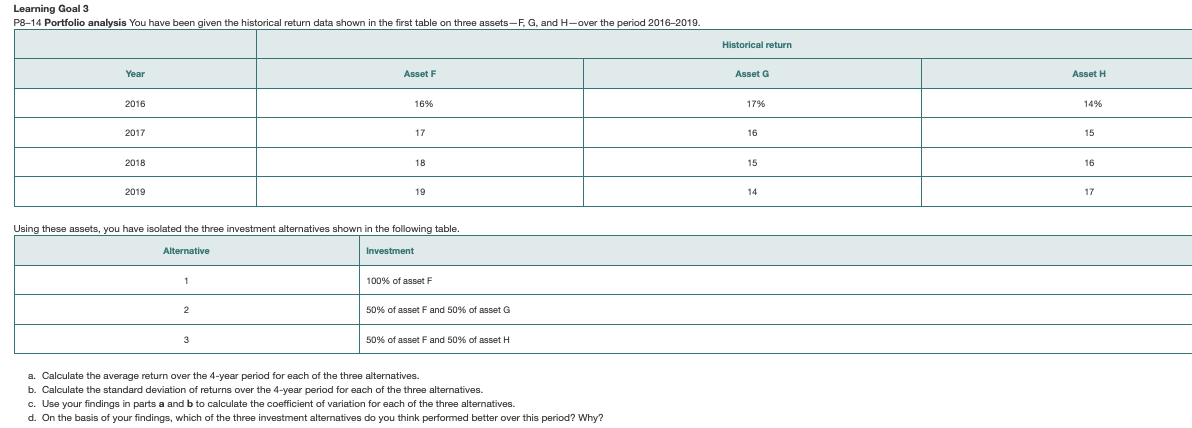
Learning Goal 3 P8-14 Portfolio analysis You have been given the historical return data shown in the first table on three assets-F, G, and H-over
Step by Step Solution
There are 3 Steps involved in it
Step: 1

Get Instant Access to Expert-Tailored Solutions
See step-by-step solutions with expert insights and AI powered tools for academic success
Step: 2

Step: 3
Ace Your Homework with AI
Get the answers you need in no time with our AI-driven, step-by-step assistance
Get Started
Ebay Tips And Tricks To Increase Your Ebay Sales
Authors: Jessica Wilson
1st Edition
1774854015, 978-1774854013