

Answered step by step
Verified Expert Solution
Question
1 Approved Answer
Learning Objective: This assignment is designed to gain additional proficiency in the use of MS Excel Statistical Functions and other functions. For this assignment, you
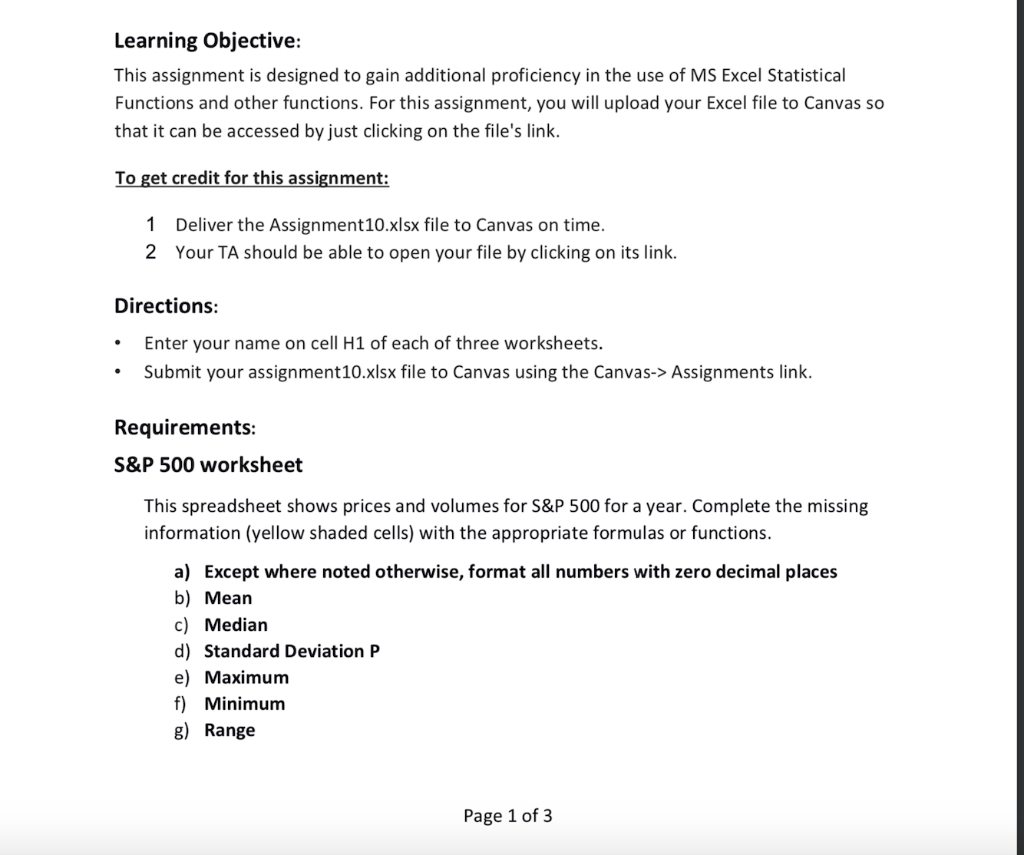
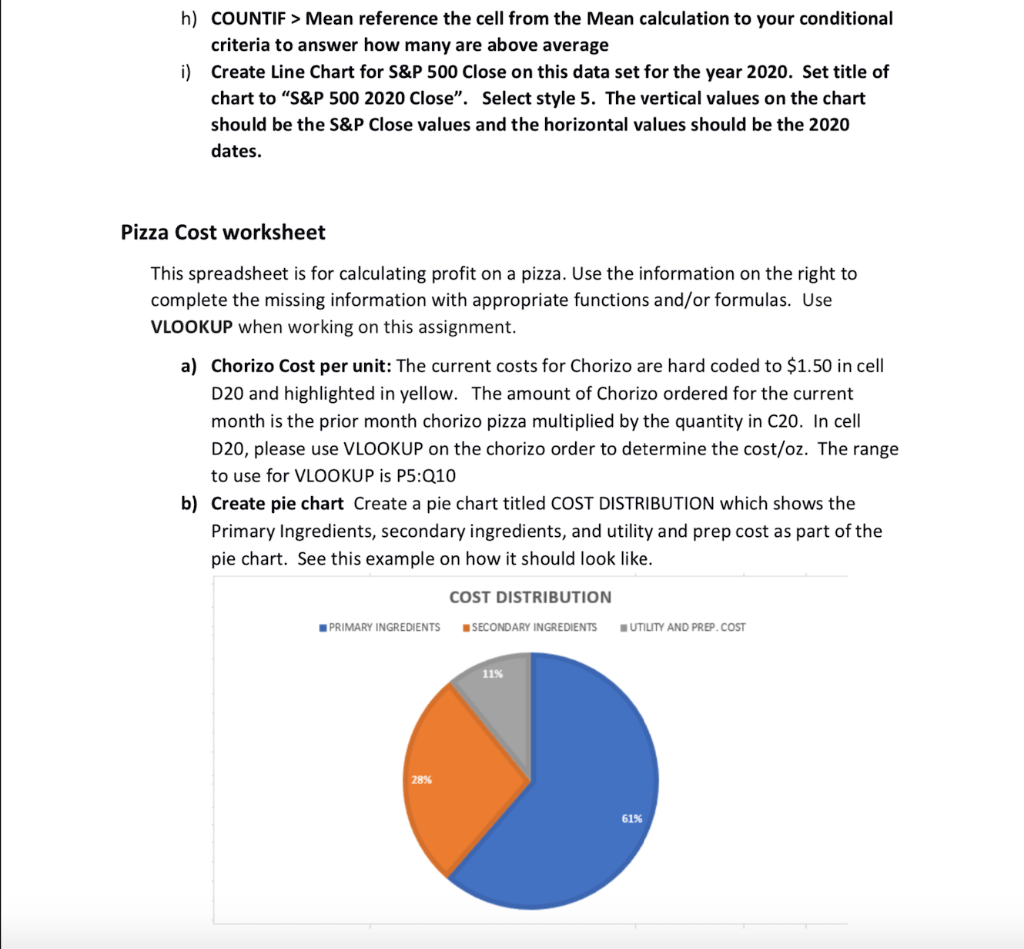
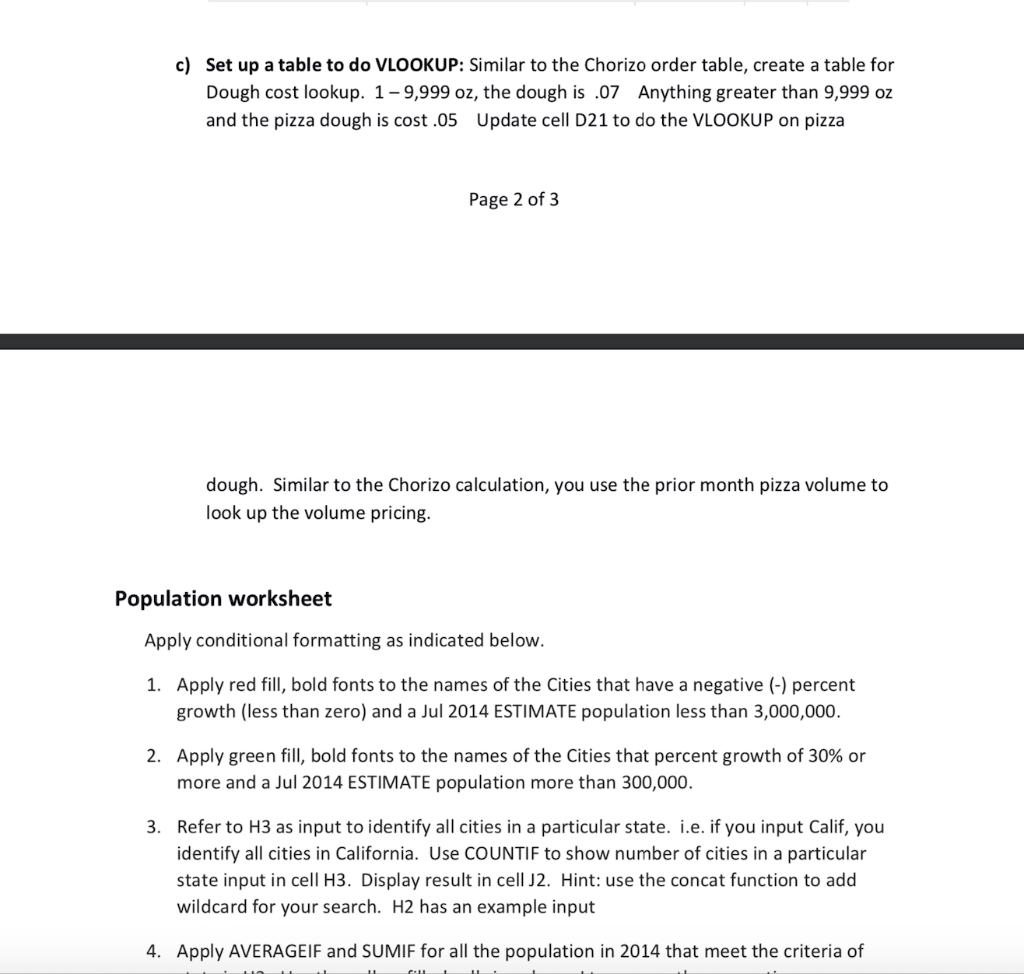
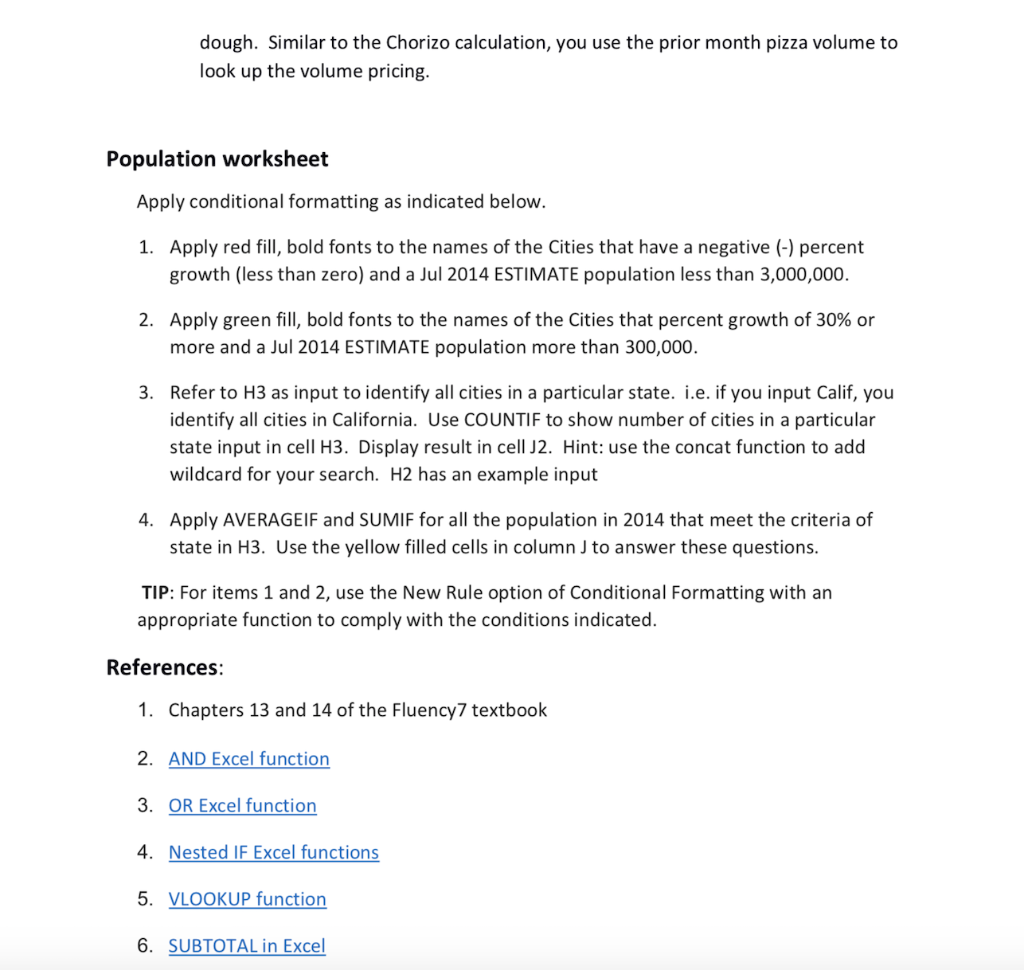
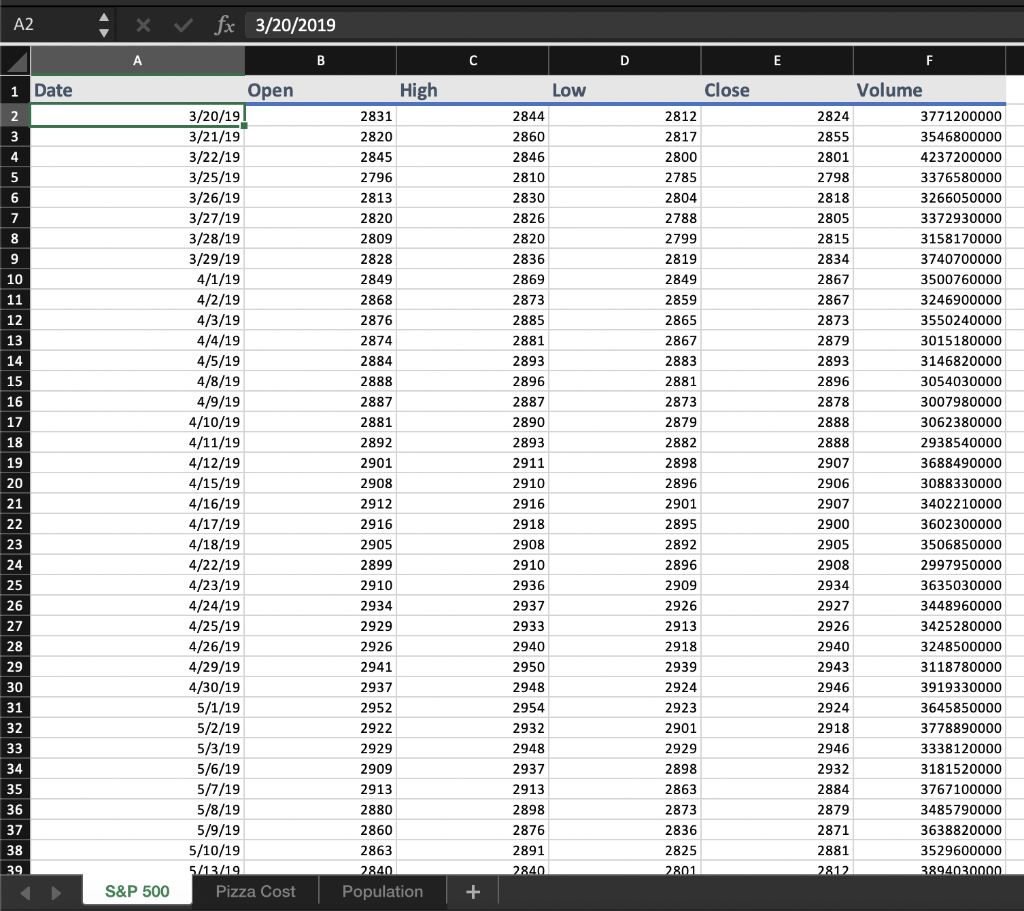
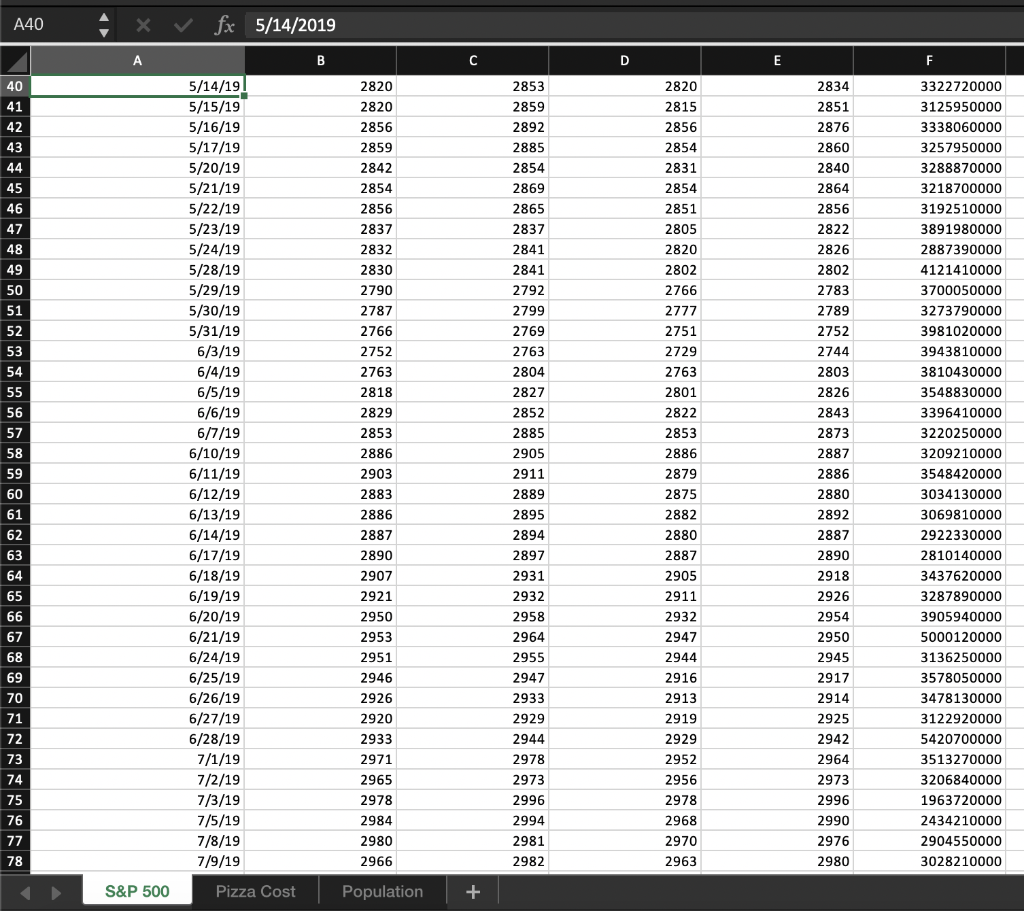
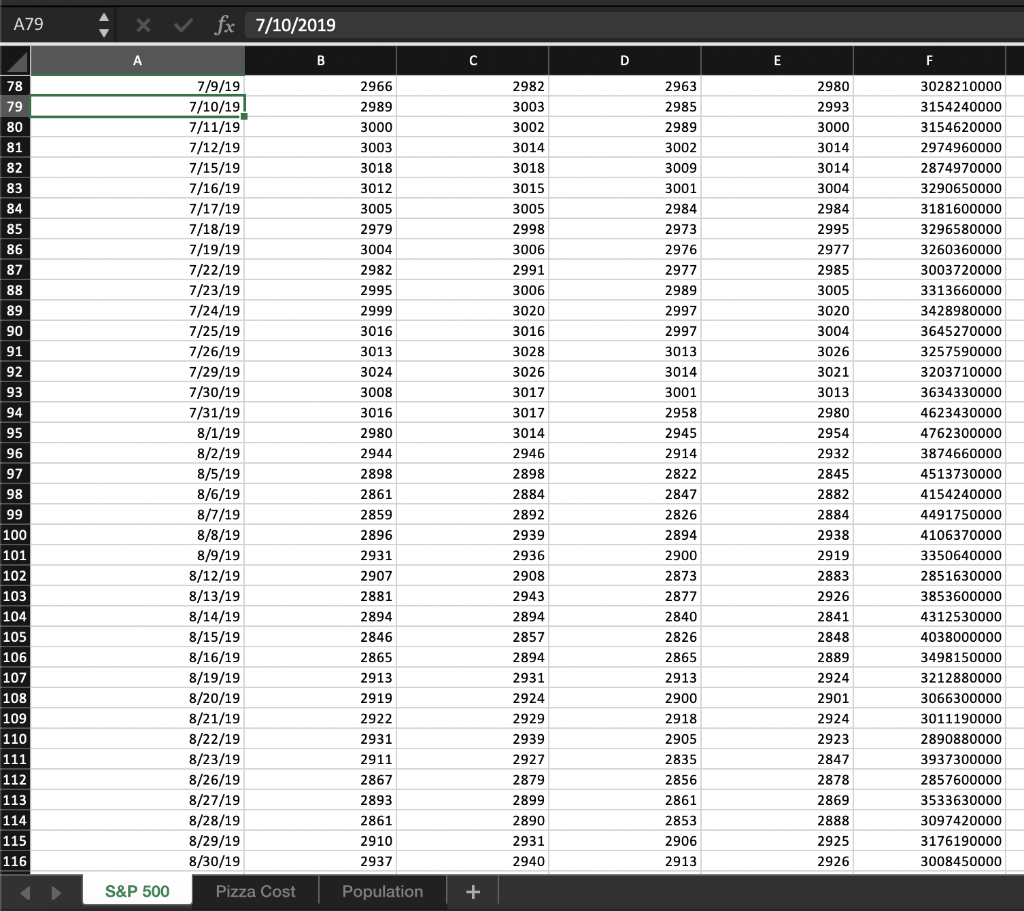
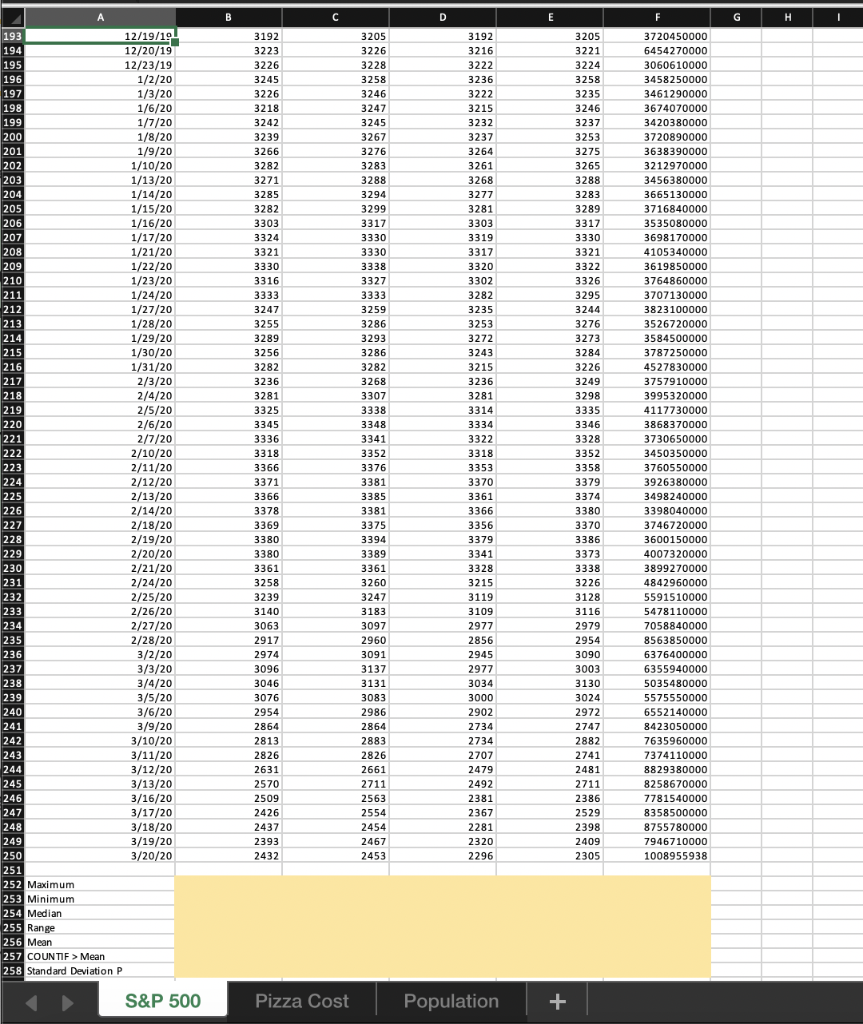
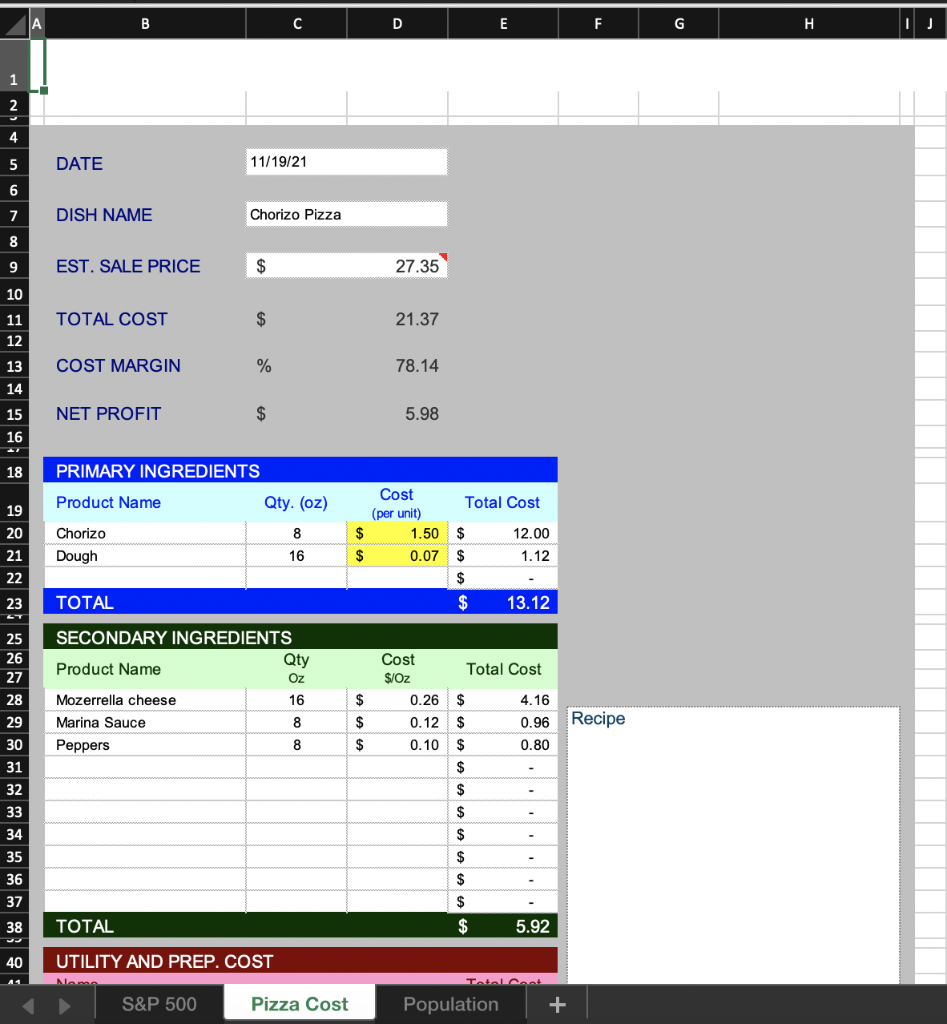
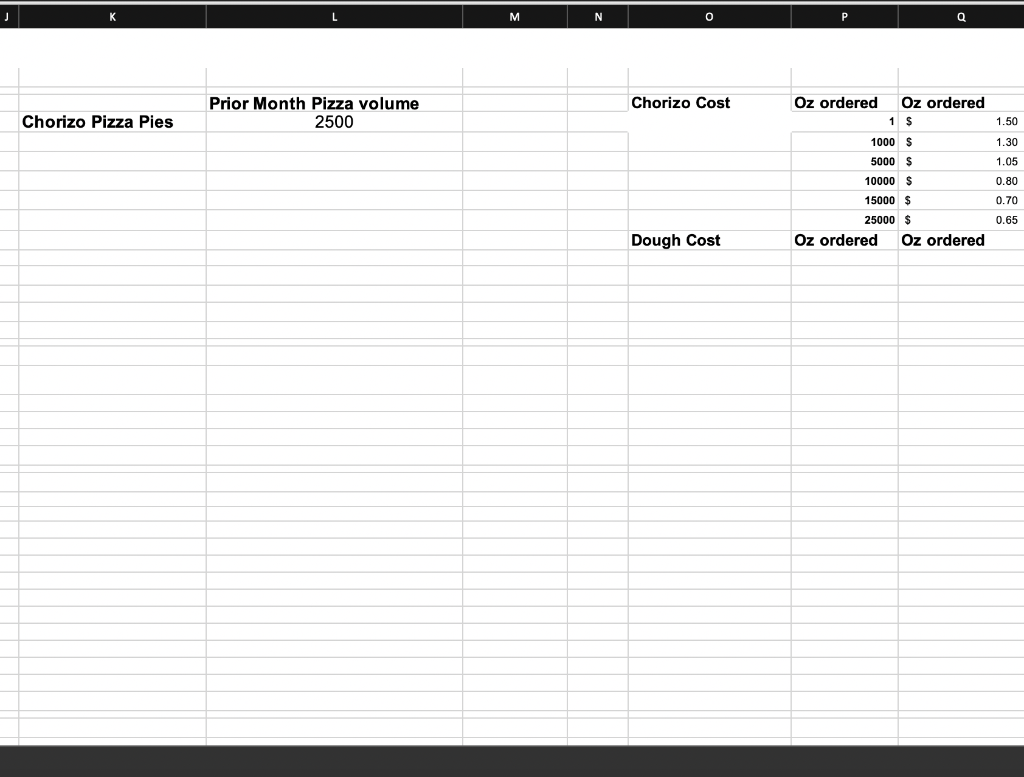
Learning Objective: This assignment is designed to gain additional proficiency in the use of MS Excel Statistical Functions and other functions. For this assignment, you will upload your Excel file to Canvas so that it can be accessed by just clicking on the file's link. To get credit for this assignment: 1 Deliver the Assignment10.xlsx file to Canvas on time. 2 Your TA should be able to open your file by clicking on its link. Directions: . Enter your name on cell H1 of each of three worksheets. Submit your assignment10.xlsx file to Canvas using the Canvas-> Assignments link. . Requirements: S&P 500 worksheet This spreadsheet shows prices and volumes for S&P 500 for a year. Complete the missing information (yellow shaded cells) with the appropriate formulas or functions. a) Except where noted otherwise, format all numbers with zero decimal places b) Mean c) Median d) Standard Deviation P e) Maximum f) Minimum g) Range Page 1 of 3 h) COUNTIF > Mean reference the cell from the Mean calculation to your conditional criteria to answer how many are above average i) Create Line Chart for S&P 500 Close on this data set for the year 2020. Set title of chart to S&P 500 2020 Close". Select style 5. The vertical values on the chart should be the S&P Close values and the horizontal values should be the 2020 dates. Pizza Cost worksheet This spreadsheet is for calculating profit on a pizza. Use the information on the right to complete the missing information with appropriate functions and/or formulas. Use VLOOKUP when working on this assignment. a) Chorizo Cost per unit: The current costs for Chorizo are hard coded to $1.50 in cell D20 and highlighted in yellow. The amount of Chorizo ordered for the current month is the prior month chorizo pizza multiplied by the quantity in C20. In cell D20, please use VLOOKUP on the chorizo order to determine the cost/oz. The range to use for VLOOKUP is P5:Q10 b) Create pie chart Create a pie chart titled COST DISTRIBUTION which shows the Primary Ingredients, secondary ingredients, and utility and prep cost as part of the pie chart. See this example on how it should look like. COST DISTRIBUTION PRIMARY INGREDIENTS SECONDARY INGREDIENTS UTILITY AND PREP. COST 11% 28% 61% c) Set up a table to do VLOOKUP: Similar to the Chorizo order table, create a table for Dough cost lookup. 1-9,999 oz, the dough is .07 Anything greater than 9,999 oz and the pizza dough is cost .05 Update cell D21 to do the VLOOKUP on pizza Page 2 of 3 dough. Similar to the Chorizo calculation, you use the prior month pizza volume to look up the volume pricing. Population worksheet Apply conditional formatting as indicated below. 1. Apply red fill, bold fonts to the names of the Cities that have a negative (-) percent growth (less than zero) and a Jul 2014 ESTIMATE population less than 3,000,000. 2. Apply green fill, bold fonts to the names of the Cities that percent growth of 30% or more and a Jul 2014 ESTIMATE population more than 300,000. 3. Refer to H3 as input to identify all cities in a particular state. i.e. if you input Calif, you identify all cities in California. Use COUNTIF to show number of cities in a particular state input in cell H3. Display result in cell J2. Hint: use the concat function to add wildcard for your search. H2 has an example input 4. Apply AVERAGEIF and SUMIF for all the population in 2014 that meet the criteria of dough. Similar to the Chorizo calculation, you use the prior month pizza volume to look up the volume pricing. Population worksheet Apply conditional formatting as indicated below. 1. Apply red fill, bold fonts to the names of the Cities that have a negative (-) percent growth (less than zero) and a Jul 2014 ESTIMATE population less than 3,000,000. 2. Apply green fill, bold fonts to the names of the Cities that percent growth of 30% or more and a Jul 2014 ESTIMATE population more than 300,000. 3. Refer to H3 as input to identify all cities in a particular state. i.e. if you input Calif, you identify all cities in California. Use COUNTIF to show number of cities in a particular state input in cell 43. Display result in cell 12. Hint: use the concat function to add wildcard for your search. H2 has an example input 4. Apply AVERAGEIF and SUMIF for all the population in 2014 that meet the criteria of state in H3. Use the yellow filled cells in columnto answer these questions. TIP: For items 1 and 2, use the New Rule option of Conditional Formatting with an appropriate function to comply with the conditions indicated. References: 1. Chapters 13 and 14 of the Fluency 7 textbook 2. AND Excel function 3. OR Excel function 4. Nested IF Excel functions 5. VLOOKUP function 6. SUBTOTAL in Excel A2 x X Vfx 3/20/2019 B C D E F Low Close 2844 2860 2846 2810 1 Date 2 2 3 4 5 6 7 8 9 10 11 12 13 14 15 2830 2826 2820 2812 2817 2800 2785 2804 2788 2799 2819 2849 2859 2865 2867 2883 2881 2873 2879 16 17 18 19 20 21 22 23 24 Open 3/20/19 3/21/19 3/22/19 3/25/19 3/26/19 3/27/19 3/28/19 3/29/19 4/1/19 4/2/19 4/3/19 4/4/19 4/5/19 4/8/19 4/9/19 4/10/19 4/11/19 4/12/19 4/15/19 4/16/19 4/17/19 4/18/19 4/22/19 4/23/19 4/24/19 4/25/19 4/26/19 4/29/19 4/30/19 5/1/19 5/2/19 5/3/19 5/6/19 5/7/19 5/8/19 5/9/19 5/10/19 5/13/19 Pizza Cost High 2831 2820 2845 2796 2813 2820 2809 2828 2849 2868 2876 2874 2884 2888 2887 2881 2892 2901 2908 2912 2916 2905 2899 2910 2934 2929 2926 2941 2937 2952 2922 2929 2909 2913 2880 2860 2863 2836 2869 2873 2885 2881 2893 2896 2887 2890 2893 2911 2910 2916 2918 2908 2910 2936 2937 2933 2940 2950 2948 2954 2932 2882 2898 2896 2901 Volume 2824 3771200000 2855 3546800000 2801 4237200000 2798 3376580000 2818 3266050000 2805 3372930000 2815 3158170000 2834 3740700000 2867 3500760000 2867 3246900000 2873 3550240000 2879 3015180000 2893 3146820000 2896 3054030000 2878 3007980000 2888 3062380000 2888 2938540000 2907 3688490000 2906 3088330000 2907 3402210000 2900 3602300000 2905 3506850000 2908 2997950000 2934 3635030000 2927 3448960000 2926 3425280000 2940 3248500000 2943 3118780000 2946 3919330000 2924 3645850000 2918 3778890000 2946 3338120000 2932 3181520000 2884 3767100000 2879 3485790000 2871 3638820000 2881 3529600000 2812 3894030000 25 26 27 28 29 30 31 32 33 34 35 36 37 38 2895 2892 2896 2909 2926 2913 2918 2939 2924 2923 2901 2929 2898 2863 2873 2836 2948 2937 2913 2898 2876 2891 2840 2825 39 2840 2801 S&P 500 Population + A40 X fx 5/14/2019 A B C D E F 40 41 42 43 2820 2820 2856 2859 2820 2815 2856 2854 44 2842 2854 2856 2837 2832 2830 45 46 47 48 49 50 51 52 53 54 55 56 57 58 59 60 61 62 63 64 65 66 67 68 69 70 5/14/19 5/15/19 5/16/19 5/17/19 5/20/19 5/21/19 5/22/19 5/23/19 5/24/19 5/28/19 5/29/19 5/30/19 5/31/19 6/3/19 6/4/19 6/5/19 6/6/19 6/7/19 6/10/19 6/11/19 6/12/19 6/13/19 6/14/19 6/17/19 6/18/19 6/19/19 6/20/19 6/21/19 6/24/19 6/25/19 6/26/19 6/27/19 6/28/19 7/1/19 7/2/19 7/3/19 7/5/19 7/8/19 7/9/19 2790 2787 2766 2752 2763 2818 2829 2853 2886 2903 2883 2886 2887 2890 2907 2921 2950 2953 2951 2946 2926 2920 2933 2971 2965 2978 2984 2980 2966 2853 2859 2892 2885 2854 2869 2865 2837 2841 2841 2792 2799 2769 2763 2804 2827 2852 2885 2905 2911 2889 2895 2894 2897 2931 2932 2958 2964 2955 2947 2933 2929 2944 2978 2973 2996 2994 2981 2982 2831 2854 2851 2805 2820 2802 2766 2777 2751 2729 2763 2801 2822 2853 2886 2879 2875 2882 2880 2887 2905 2911 2932 2947 2944 2916 2913 2919 2929 2952 2956 2978 2968 2970 2963 2834 2851 2876 2860 2840 2864 2856 2822 2826 2802 2783 2789 2752 2744 2803 2826 2843 2873 2887 2886 2880 2892 2887 2890 2918 2926 2954 2950 2945 2917 2914 2925 2942 2964 2973 2996 3322720000 3125950000 3338060000 3257950000 3288870000 3218700000 3192510000 3891980000 2887390000 4121410000 3700050000 3273790000 3981020000 3943810000 3810430000 3548830000 3396410000 3220250000 3209210000 3548420000 3034130000 3069810000 2922330000 2810140000 3437620000 3287890000 3905940000 5000120000 3136250000 3578050000 3478130000 3122920000 5420700000 3513270000 3206840000 1963720000 2434210000 2904550000 3028210000 71 72 73 74 75 76 77 78 2990 2976 2980 S&P 500 Pizza Cost Population + A79 X Vfx 7/10/2019 B C D E 2980 78 79 80 81 82 2963 2985 2989 3002 3009 83 84 85 86 87 2966 2989 3000 3003 3018 3012 3005 2979 3004 2982 2995 2999 3016 3013 3024 3008 3016 2980 88 89 90 91 92 93 94 95 96 97 98 99 100 101 102 103 104 105 106 107 108 109 110 111 112 113 7/9/19 7/10/19 7/11/19 7/12/19 7/15/19 7/16/19 7/17/19 7/18/19 7/19/19 7/22/19 7/23/19 7/24/19 7/25/19 7/26/19 7/29/19 7/30/19 7/31/19 8/1/19 8/2/19 8/5/19 8/6/19 8/7/19 8/8/19 8/9/19 8/12/19 8/13/19 8/14/19 8/15/19 8/16/19 8/19/19 8/20/19 8/21/19 8/22/19 8/23/19 8/26/19 8/27/19 8/28/19 8/29/19 8/30/19 2982 3003 3002 3014 3018 3015 3005 2998 3006 2991 3006 3020 3016 3028 3026 3017 3017 3014 2946 2898 2884 2892 2939 2936 2908 2943 2894 2857 2894 2944 3001 2984 2973 2976 2977 2989 2997 2997 3013 3014 3001 2958 2945 2914 2822 2847 2826 2894 2900 2873 2877 2840 F 3028210000 3154240000 3154620000 2974960000 2874970000 3290650000 3181600000 3296580000 3260360000 3003720000 3313660000 3428980000 3645270000 3257590000 3203710000 3634330000 4623430000 4762300000 3874660000 4513730000 4154240000 4491750000 4106370000 3350640000 2851630000 3853600000 4312530000 4038000000 3498150000 3212880000 3066300000 3011190000 2890880000 3937300000 2857600000 3533630000 3097420000 3176190000 3008450000 2993 3000 3014 3014 3004 2984 2995 2977 2985 3005 3020 3004 3026 3021 3013 2980 2954 2932 2845 2882 2884 2938 2919 2883 2926 2841 2848 2889 2924 2901 2924 2923 2847 2878 2869 2888 2925 2926 2898 2861 2859 2896 2931 2907 2881 2894 2846 2865 2913 2919 2922 2931 2911 2867 2893 2861 2910 2937 2826 2931 2924 2929 2939 2927 2879 2899 2890 2931 2940 2865 2913 2900 2918 2905 2835 2856 2861 2853 2906 2913 114 115 116 S&P 500 Pizza Cost Population + B C D E F G H I A 193 194 195 196 197 198 199 200 201 202 1203 204 205 206 207 208 209 210 211 212 213 214 215 216 217 218 219 220 221 222 223 224 225 226 227 228 229 230 231 232 233 234 235 236 237 238 239 240 241 242 243 244 245 246 247 248 249 250 251 252 Maximum 253 Minimum 254 Median 255 Range 256 Mean 257 COUNTIF > Mean 258 Standard Deviation P 12/19/10 12/20/19 12/23/19 1/2/20 1/3/20 1/6/20 1/7/20 1/8/20 1/9/20 1/10/20 1/13/20 1/14/20 1/15/20 1/16/20 1/17/20 1/21/20 1/22/20 1/23/20 1/24/20 1/27/20 1/28/20 1/29/20 1/30/20 1/31/20 2/3/20 2/4/20 2/5/20 2/6/20 2/7/20 2/10/20 2/11/20 2/12/20 2/13/20 2/14/20 2/18/20 2/19/20 2/20/20 2/21/20 2/24/20 2/25/20 2/26/20 2/27/20 2/28/20 3/2/20 3/3/20 3/4/20 3/5/20 3/6/20 3/9/20 3/10/20 3/11/20 3/12/20 3/13/20 3/16/20 3/17/20 3/18/20 3/19/20 3/20/20 3192 3223 3226 3245 3226 3218 3242 3239 3266 3282 3271 3285 3282 3303 3324 3321 3330 3316 3333 3247 3255 3289 3256 3282 3236 3281 3325 3345 3336 3318 3366 3371 3366 3378 3369 3380 3380 3361 3258 3239 3140 3063 2917 2974 3096 3046 3076 2954 2864 2813 2826 2631 2570 2509 2426 2437 2393 2432 3205 3226 3228 3258 3246 3247 3245 3267 3276 3283 3288 3294 3299 3317 3330 3330 3338 3327 3333 3259 3286 3293 3286 3282 3268 3307 3338 3348 3341 3352 3376 3381 3385 3381 3375 3394 3389 3361 3260 3247 3183 3097 2960 3091 3137 3131 3083 2986 2864 2883 2826 2661 2711 2563 2554 2454 2467 2453 3192 3216 3222 3236 3222 3215 3232 3237 3264 3261 3268 3277 3281 3303 3319 3317 3320 3302 3282 3235 3253 3272 3243 3215 3236 3281 3314 3334 3322 3318 3353 3370 3361 3366 3356 3379 3341 3328 3215 3119 3109 2977 2856 2945 2977 3034 3000 2902 2734 2734 2707 2479 2492 2381 2367 2281 2320 2296 3205 3221 3224 3258 3235 3246 3237 3253 3275 3265 3288 3283 3289 3317 3330 3321 3322 3326 3295 3244 3276 3273 3284 3226 3249 3298 3335 3346 3328 3352 3358 3379 3374 3380 3370 3386 3373 3338 3226 3128 3116 2979 2954 3090 3003 3130 3024 2972 2747 2882 2741 2481 2711 2386 2529 2398 2409 2305 3720450000 6454270000 3060610000 3458250000 3461290000 3674070000 3420380000 3720890000 3638390000 3212970000 3456380000 3665130000 3716840000 3535080000 3698170000 4105340000 3619850000 3764860000 3707130000 3823100000 3526720000 3584500000 3787250000 4527830000 3757910000 39953 20000 4117730000 3868370000 3730650000 3450350000 3760550000 3926380000 3498240000 3398040000 3746720000 3600150000 40073 20000 3899270000 4842960000 5591510000 5478110000 7058840000 8563850000 6376400000 6355940000 5035480000 5575550000 6552140000 8423050000 7635960000 7374110000 8829380000 8258670000 7781540000 8358500000 8755780000 7946710000 1008955938 S&P 500 Pizza Cost Population + B C D E F G H 1 2 4 5 DATE 11/19/21 6 7 DISH NAME Chorizo Pizza 8 9 EST. SALE PRICE $ 27.35 10 TOTAL COST $ 21.37 11 12 13 COST MARGIN % 78.14 14 15 NET PROFIT $ 5.98 16 18 PRIMARY INGREDIENTS Product Name Qty. (oz) 8 19 20 21 22 Chorizo Dough 16 Cost Total Cost (per unit) $ 1.50 $ 12.00 $ 0.07 $ 1.12 $ 13.12 23 TOTAL LT 25 26 27 28 29 SECONDARY INGREDIENTS Qty Product Name Oz Mozerrella cheese 16 Marina Sauce 8 Peppers 8 $ Cost Total Cost $/Oz 0.26 $ 4.16 0.12 $ 0.96 0.10 $ 0.80 $ Recipe 30 $ 31 $ $ 32 33 34 $ $ $ $ 35 36 37 $ 38 TOTAL 5.92 40 UTILITY AND PREP. COST Non Totalcat S&P 500 Pizza Cost Population + M N Chorizo Cost Prior Month Pizza volume 2500 Chorizo Pizza Pies Oz ordered Oz ordered 1 $ 1000 $ 5000 $ 10000 $ 15000 $ 25000 $ Oz ordered Oz ordered 1.50 1.30 1.05 0.80 0.70 0.65 Dough Cost Learning Objective: This assignment is designed to gain additional proficiency in the use of MS Excel Statistical Functions and other functions. For this assignment, you will upload your Excel file to Canvas so that it can be accessed by just clicking on the file's link. To get credit for this assignment: 1 Deliver the Assignment10.xlsx file to Canvas on time. 2 Your TA should be able to open your file by clicking on its link. Directions: . Enter your name on cell H1 of each of three worksheets. Submit your assignment10.xlsx file to Canvas using the Canvas-> Assignments link. . Requirements: S&P 500 worksheet This spreadsheet shows prices and volumes for S&P 500 for a year. Complete the missing information (yellow shaded cells) with the appropriate formulas or functions. a) Except where noted otherwise, format all numbers with zero decimal places b) Mean c) Median d) Standard Deviation P e) Maximum f) Minimum g) Range Page 1 of 3 h) COUNTIF > Mean reference the cell from the Mean calculation to your conditional criteria to answer how many are above average i) Create Line Chart for S&P 500 Close on this data set for the year 2020. Set title of chart to S&P 500 2020 Close". Select style 5. The vertical values on the chart should be the S&P Close values and the horizontal values should be the 2020 dates. Pizza Cost worksheet This spreadsheet is for calculating profit on a pizza. Use the information on the right to complete the missing information with appropriate functions and/or formulas. Use VLOOKUP when working on this assignment. a) Chorizo Cost per unit: The current costs for Chorizo are hard coded to $1.50 in cell D20 and highlighted in yellow. The amount of Chorizo ordered for the current month is the prior month chorizo pizza multiplied by the quantity in C20. In cell D20, please use VLOOKUP on the chorizo order to determine the cost/oz. The range to use for VLOOKUP is P5:Q10 b) Create pie chart Create a pie chart titled COST DISTRIBUTION which shows the Primary Ingredients, secondary ingredients, and utility and prep cost as part of the pie chart. See this example on how it should look like. COST DISTRIBUTION PRIMARY INGREDIENTS SECONDARY INGREDIENTS UTILITY AND PREP. COST 11% 28% 61% c) Set up a table to do VLOOKUP: Similar to the Chorizo order table, create a table for Dough cost lookup. 1-9,999 oz, the dough is .07 Anything greater than 9,999 oz and the pizza dough is cost .05 Update cell D21 to do the VLOOKUP on pizza Page 2 of 3 dough. Similar to the Chorizo calculation, you use the prior month pizza volume to look up the volume pricing. Population worksheet Apply conditional formatting as indicated below. 1. Apply red fill, bold fonts to the names of the Cities that have a negative (-) percent growth (less than zero) and a Jul 2014 ESTIMATE population less than 3,000,000. 2. Apply green fill, bold fonts to the names of the Cities that percent growth of 30% or more and a Jul 2014 ESTIMATE population more than 300,000. 3. Refer to H3 as input to identify all cities in a particular state. i.e. if you input Calif, you identify all cities in California. Use COUNTIF to show number of cities in a particular state input in cell H3. Display result in cell J2. Hint: use the concat function to add wildcard for your search. H2 has an example input 4. Apply AVERAGEIF and SUMIF for all the population in 2014 that meet the criteria of dough. Similar to the Chorizo calculation, you use the prior month pizza volume to look up the volume pricing. Population worksheet Apply conditional formatting as indicated below. 1. Apply red fill, bold fonts to the names of the Cities that have a negative (-) percent growth (less than zero) and a Jul 2014 ESTIMATE population less than 3,000,000. 2. Apply green fill, bold fonts to the names of the Cities that percent growth of 30% or more and a Jul 2014 ESTIMATE population more than 300,000. 3. Refer to H3 as input to identify all cities in a particular state. i.e. if you input Calif, you identify all cities in California. Use COUNTIF to show number of cities in a particular state input in cell 43. Display result in cell 12. Hint: use the concat function to add wildcard for your search. H2 has an example input 4. Apply AVERAGEIF and SUMIF for all the population in 2014 that meet the criteria of state in H3. Use the yellow filled cells in columnto answer these questions. TIP: For items 1 and 2, use the New Rule option of Conditional Formatting with an appropriate function to comply with the conditions indicated. References: 1. Chapters 13 and 14 of the Fluency 7 textbook 2. AND Excel function 3. OR Excel function 4. Nested IF Excel functions 5. VLOOKUP function 6. SUBTOTAL in Excel A2 x X Vfx 3/20/2019 B C D E F Low Close 2844 2860 2846 2810 1 Date 2 2 3 4 5 6 7 8 9 10 11 12 13 14 15 2830 2826 2820 2812 2817 2800 2785 2804 2788 2799 2819 2849 2859 2865 2867 2883 2881 2873 2879 16 17 18 19 20 21 22 23 24 Open 3/20/19 3/21/19 3/22/19 3/25/19 3/26/19 3/27/19 3/28/19 3/29/19 4/1/19 4/2/19 4/3/19 4/4/19 4/5/19 4/8/19 4/9/19 4/10/19 4/11/19 4/12/19 4/15/19 4/16/19 4/17/19 4/18/19 4/22/19 4/23/19 4/24/19 4/25/19 4/26/19 4/29/19 4/30/19 5/1/19 5/2/19 5/3/19 5/6/19 5/7/19 5/8/19 5/9/19 5/10/19 5/13/19 Pizza Cost High 2831 2820 2845 2796 2813 2820 2809 2828 2849 2868 2876 2874 2884 2888 2887 2881 2892 2901 2908 2912 2916 2905 2899 2910 2934 2929 2926 2941 2937 2952 2922 2929 2909 2913 2880 2860 2863 2836 2869 2873 2885 2881 2893 2896 2887 2890 2893 2911 2910 2916 2918 2908 2910 2936 2937 2933 2940 2950 2948 2954 2932 2882 2898 2896 2901 Volume 2824 3771200000 2855 3546800000 2801 4237200000 2798 3376580000 2818 3266050000 2805 3372930000 2815 3158170000 2834 3740700000 2867 3500760000 2867 3246900000 2873 3550240000 2879 3015180000 2893 3146820000 2896 3054030000 2878 3007980000 2888 3062380000 2888 2938540000 2907 3688490000 2906 3088330000 2907 3402210000 2900 3602300000 2905 3506850000 2908 2997950000 2934 3635030000 2927 3448960000 2926 3425280000 2940 3248500000 2943 3118780000 2946 3919330000 2924 3645850000 2918 3778890000 2946 3338120000 2932 3181520000 2884 3767100000 2879 3485790000 2871 3638820000 2881 3529600000 2812 3894030000 25 26 27 28 29 30 31 32 33 34 35 36 37 38 2895 2892 2896 2909 2926 2913 2918 2939 2924 2923 2901 2929 2898 2863 2873 2836 2948 2937 2913 2898 2876 2891 2840 2825 39 2840 2801 S&P 500 Population + A40 X fx 5/14/2019 A B C D E F 40 41 42 43 2820 2820 2856 2859 2820 2815 2856 2854 44 2842 2854 2856 2837 2832 2830 45 46 47 48 49 50 51 52 53 54 55 56 57 58 59 60 61 62 63 64 65 66 67 68 69 70 5/14/19 5/15/19 5/16/19 5/17/19 5/20/19 5/21/19 5/22/19 5/23/19 5/24/19 5/28/19 5/29/19 5/30/19 5/31/19 6/3/19 6/4/19 6/5/19 6/6/19 6/7/19 6/10/19 6/11/19 6/12/19 6/13/19 6/14/19 6/17/19 6/18/19 6/19/19 6/20/19 6/21/19 6/24/19 6/25/19 6/26/19 6/27/19 6/28/19 7/1/19 7/2/19 7/3/19 7/5/19 7/8/19 7/9/19 2790 2787 2766 2752 2763 2818 2829 2853 2886 2903 2883 2886 2887 2890 2907 2921 2950 2953 2951 2946 2926 2920 2933 2971 2965 2978 2984 2980 2966 2853 2859 2892 2885 2854 2869 2865 2837 2841 2841 2792 2799 2769 2763 2804 2827 2852 2885 2905 2911 2889 2895 2894 2897 2931 2932 2958 2964 2955 2947 2933 2929 2944 2978 2973 2996 2994 2981 2982 2831 2854 2851 2805 2820 2802 2766 2777 2751 2729 2763 2801 2822 2853 2886 2879 2875 2882 2880 2887 2905 2911 2932 2947 2944 2916 2913 2919 2929 2952 2956 2978 2968 2970 2963 2834 2851 2876 2860 2840 2864 2856 2822 2826 2802 2783 2789 2752 2744 2803 2826 2843 2873 2887 2886 2880 2892 2887 2890 2918 2926 2954 2950 2945 2917 2914 2925 2942 2964 2973 2996 3322720000 3125950000 3338060000 3257950000 3288870000 3218700000 3192510000 3891980000 2887390000 4121410000 3700050000 3273790000 3981020000 3943810000 3810430000 3548830000 3396410000 3220250000 3209210000 3548420000 3034130000 3069810000 2922330000 2810140000 3437620000 3287890000 3905940000 5000120000 3136250000 3578050000 3478130000 3122920000 5420700000 3513270000 3206840000 1963720000 2434210000 2904550000 3028210000 71 72 73 74 75 76 77 78 2990 2976 2980 S&P 500 Pizza Cost Population + A79 X Vfx 7/10/2019 B C D E 2980 78 79 80 81 82 2963 2985 2989 3002 3009 83 84 85 86 87 2966 2989 3000 3003 3018 3012 3005 2979 3004 2982 2995 2999 3016 3013 3024 3008 3016 2980 88 89 90 91 92 93 94 95 96 97 98 99 100 101 102 103 104 105 106 107 108 109 110 111 112 113 7/9/19 7/10/19 7/11/19 7/12/19 7/15/19 7/16/19 7/17/19 7/18/19 7/19/19 7/22/19 7/23/19 7/24/19 7/25/19 7/26/19 7/29/19 7/30/19 7/31/19 8/1/19 8/2/19 8/5/19 8/6/19 8/7/19 8/8/19 8/9/19 8/12/19 8/13/19 8/14/19 8/15/19 8/16/19 8/19/19 8/20/19 8/21/19 8/22/19 8/23/19 8/26/19 8/27/19 8/28/19 8/29/19 8/30/19 2982 3003 3002 3014 3018 3015 3005 2998 3006 2991 3006 3020 3016 3028 3026 3017 3017 3014 2946 2898 2884 2892 2939 2936 2908 2943 2894 2857 2894 2944 3001 2984 2973 2976 2977 2989 2997 2997 3013 3014 3001 2958 2945 2914 2822 2847 2826 2894 2900 2873 2877 2840 F 3028210000 3154240000 3154620000 2974960000 2874970000 3290650000 3181600000 3296580000 3260360000 3003720000 3313660000 3428980000 3645270000 3257590000 3203710000 3634330000 4623430000 4762300000 3874660000 4513730000 4154240000 4491750000 4106370000 3350640000 2851630000 3853600000 4312530000 4038000000 3498150000 3212880000 3066300000 3011190000 2890880000 3937300000 2857600000 3533630000 3097420000 3176190000 3008450000 2993 3000 3014 3014 3004 2984 2995 2977 2985 3005 3020 3004 3026 3021 3013 2980 2954 2932 2845 2882 2884 2938 2919 2883 2926 2841 2848 2889 2924 2901 2924 2923 2847 2878 2869 2888 2925 2926 2898 2861 2859 2896 2931 2907 2881 2894 2846 2865 2913 2919 2922 2931 2911 2867 2893 2861 2910 2937 2826 2931 2924 2929 2939 2927 2879 2899 2890 2931 2940 2865 2913 2900 2918 2905 2835 2856 2861 2853 2906 2913 114 115 116 S&P 500 Pizza Cost Population + B C D E F G H I A 193 194 195 196 197 198 199 200 201 202 1203 204 205 206 207 208 209 210 211 212 213 214 215 216 217 218 219 220 221 222 223 224 225 226 227 228 229 230 231 232 233 234 235 236 237 238 239 240 241 242 243 244 245 246 247 248 249 250 251 252 Maximum 253 Minimum 254 Median 255 Range 256 Mean 257 COUNTIF > Mean 258 Standard Deviation P 12/19/10 12/20/19 12/23/19 1/2/20 1/3/20 1/6/20 1/7/20 1/8/20 1/9/20 1/10/20 1/13/20 1/14/20 1/15/20 1/16/20 1/17/20 1/21/20 1/22/20 1/23/20 1/24/20 1/27/20 1/28/20 1/29/20 1/30/20 1/31/20 2/3/20 2/4/20 2/5/20 2/6/20 2/7/20 2/10/20 2/11/20 2/12/20 2/13/20 2/14/20 2/18/20 2/19/20 2/20/20 2/21/20 2/24/20 2/25/20 2/26/20 2/27/20 2/28/20 3/2/20 3/3/20 3/4/20 3/5/20 3/6/20 3/9/20 3/10/20 3/11/20 3/12/20 3/13/20 3/16/20 3/17/20 3/18/20 3/19/20 3/20/20 3192 3223 3226 3245 3226 3218 3242 3239 3266 3282 3271 3285 3282 3303 3324 3321 3330 3316 3333 3247 3255 3289 3256 3282 3236 3281 3325 3345 3336 3318 3366 3371 3366 3378 3369 3380 3380 3361 3258 3239 3140 3063 2917 2974 3096 3046 3076 2954 2864 2813 2826 2631 2570 2509 2426 2437 2393 2432 3205 3226 3228 3258 3246 3247 3245 3267 3276 3283 3288 3294 3299 3317 3330 3330 3338 3327 3333 3259 3286 3293 3286 3282 3268 3307 3338 3348 3341 3352 3376 3381 3385 3381 3375 3394 3389 3361 3260 3247 3183 3097 2960 3091 3137 3131 3083 2986 2864 2883 2826 2661 2711 2563 2554 2454 2467 2453 3192 3216 3222 3236 3222 3215 3232 3237 3264 3261 3268 3277 3281 3303 3319 3317 3320 3302 3282 3235 3253 3272 3243 3215 3236 3281 3314 3334 3322 3318 3353 3370 3361 3366 3356 3379 3341 3328 3215 3119 3109 2977 2856 2945 2977 3034 3000 2902 2734 2734 2707 2479 2492 2381 2367 2281 2320 2296 3205 3221 3224 3258 3235 3246 3237 3253 3275 3265 3288 3283 3289 3317 3330 3321 3322 3326 3295 3244 3276 3273 3284 3226 3249 3298 3335 3346 3328 3352 3358 3379 3374 3380 3370 3386 3373 3338 3226 3128 3116 2979 2954 3090 3003 3130 3024 2972 2747 2882 2741 2481 2711 2386 2529 2398 2409 2305 3720450000 6454270000 3060610000 3458250000 3461290000 3674070000 3420380000 3720890000 3638390000 3212970000 3456380000 3665130000 3716840000 3535080000 3698170000 4105340000 3619850000 3764860000 3707130000 3823100000 3526720000 3584500000 3787250000 4527830000 3757910000 39953 20000 4117730000 3868370000 3730650000 3450350000 3760550000 3926380000 3498240000 3398040000 3746720000 3600150000 40073 20000 3899270000 4842960000 5591510000 5478110000 7058840000 8563850000 6376400000 6355940000 5035480000 5575550000 6552140000 8423050000 7635960000 7374110000 8829380000 8258670000 7781540000 8358500000 8755780000 7946710000 1008955938 S&P 500 Pizza Cost Population + B C D E F G H 1 2 4 5 DATE 11/19/21 6 7 DISH NAME Chorizo Pizza 8 9 EST. SALE PRICE $ 27.35 10 TOTAL COST $ 21.37 11 12 13 COST MARGIN % 78.14 14 15 NET PROFIT $ 5.98 16 18 PRIMARY INGREDIENTS Product Name Qty. (oz) 8 19 20 21 22 Chorizo Dough 16 Cost Total Cost (per unit) $ 1.50 $ 12.00 $ 0.07 $ 1.12 $ 13.12 23 TOTAL LT 25 26 27 28 29 SECONDARY INGREDIENTS Qty Product Name Oz Mozerrella cheese 16 Marina Sauce 8 Peppers 8 $ Cost Total Cost $/Oz 0.26 $ 4.16 0.12 $ 0.96 0.10 $ 0.80 $ Recipe 30 $ 31 $ $ 32 33 34 $ $ $ $ 35 36 37 $ 38 TOTAL 5.92 40 UTILITY AND PREP. COST Non Totalcat S&P 500 Pizza Cost Population + M N Chorizo Cost Prior Month Pizza volume 2500 Chorizo Pizza Pies Oz ordered Oz ordered 1 $ 1000 $ 5000 $ 10000 $ 15000 $ 25000 $ Oz ordered Oz ordered 1.50 1.30 1.05 0.80 0.70 0.65 Dough Cost
Step by Step Solution
There are 3 Steps involved in it
Step: 1

Get Instant Access to Expert-Tailored Solutions
See step-by-step solutions with expert insights and AI powered tools for academic success
Step: 2

Step: 3
Ace Your Homework with AI
Get the answers you need in no time with our AI-driven, step-by-step assistance
Get Started
Overcoming Debt Achieving Financial Freedom
Authors: Cindy Zuniga-Sanchez
1st Edition
1119902320, 978-1119902324