Question
Lecturer, anyone can do this completely? not just Roughly explain pls Allocated company: Wesfarmers Limited (Stock Code: WES) Question: Assume that you are also considering
Lecturer, anyone can do this completely? not just Roughly explain pls
Allocated company: Wesfarmers Limited (Stock Code: WES)
Question:
Assume that you are also considering investing in the stock of BHP Billiton. You have limited funds to invest and therefore, you can invest in either of the company (BHP Billiton or your allocated company ). Compare your companys financial statements, and performance, with those of the BHP Billiton.


If you were making a decision to invest in one of the two companies, which company would you choose?
Discuss.
[In evaluating and comparing the companies, use appropriate ratios and other analyses. Provide clear justification as to why you believe your approach to evaluation is appropriate for investment decision purpose].
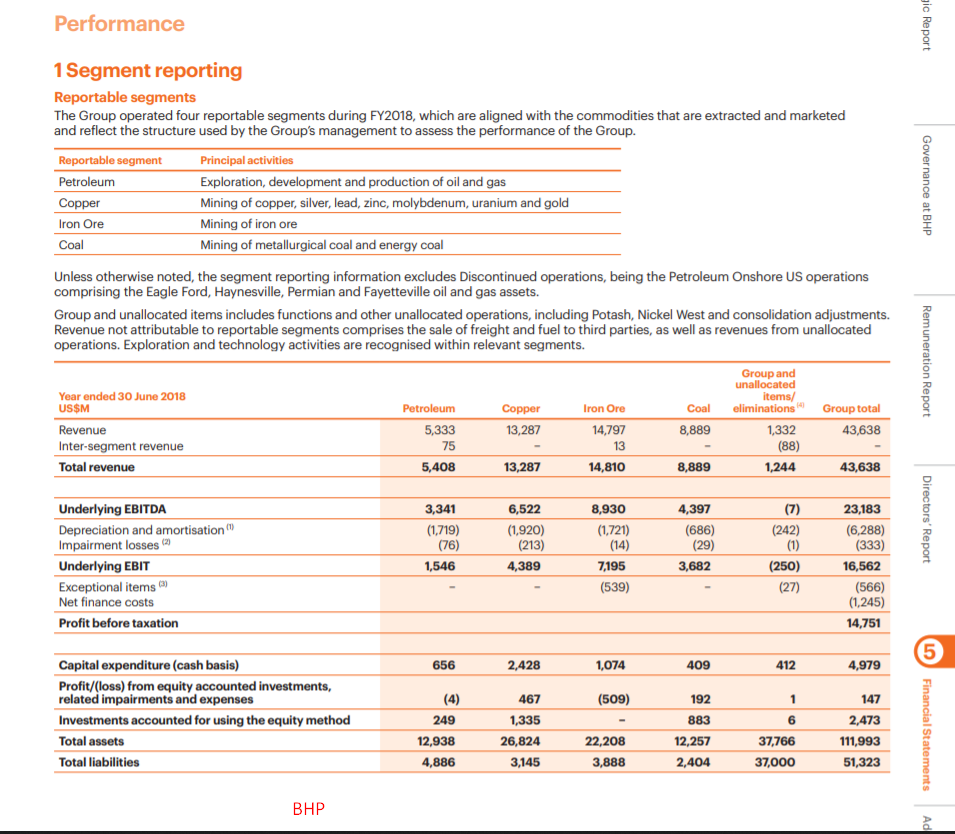
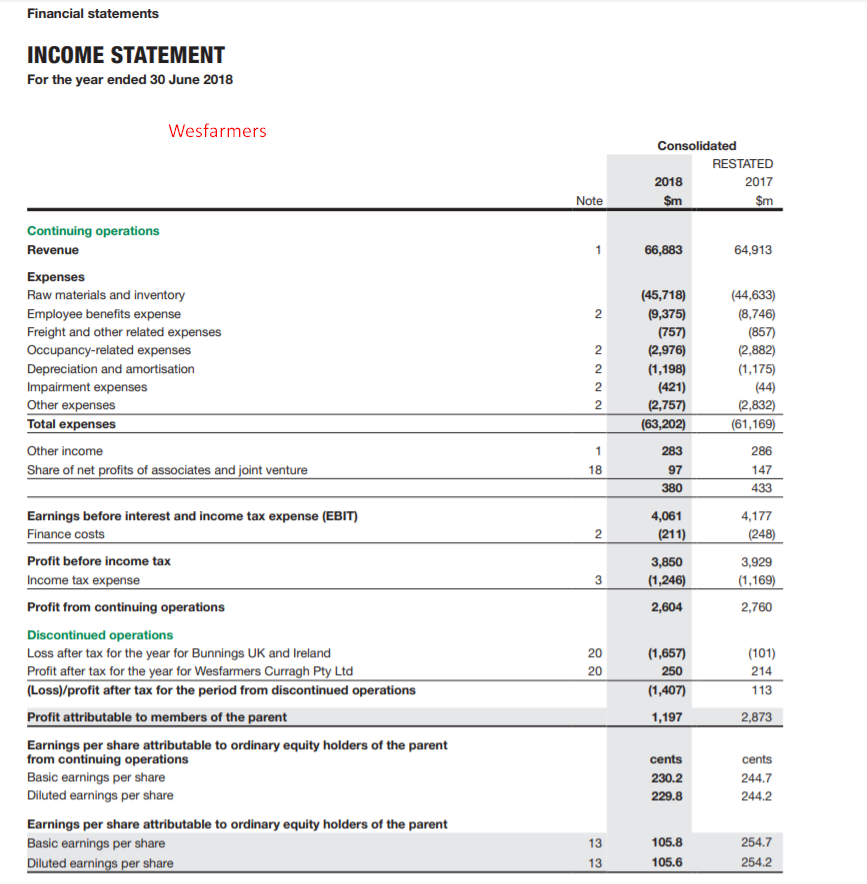
Performance gic Report 1 Segment reporting Reportable segments The Group operated four reportable segments during FY2018, which are aligned with the commodities that are extracted and marketed and reflect the structure used by the Group's management to assess the performance of the Group. Reportable segment Petroleum Copper Iron Ore Principal activities Exploration, development and production of oil and gas Mining of copper, silver, lead, zinc, molybdenum, uranium and gold Mining of iron ore Mining of metallurgical coal and energy coal Governance at BHP Coal Unless otherwise noted, the segment reporting information excludes Discontinued operations, being the Petroleum Onshore US operations comprising the Eagle Ford, Haynesville, Permian and Fayetteville oil and gas assets. Group and unallocated items includes functions and other unallocated operations, including Potash, Nickel West and consolidation adjustments. Revenue not attributable to reportable segments comprises the sale of freight and fuel to third parties, as well as revenues from unallocated operations. Exploration and technology activities are recognised within relevant segments. Remuneration Report Year ended 30 June 2018 US$M Group and unallocated items/ eliminations Petroleum Iron Ore Group total Copper 13,287 Coal 8,889 43,638 Revenue Inter-segment revenue Total revenue 5,333 75 5,408 14,797 13 14,810 1,332 (88) 1,244 13,287 8,889 43,638 Underlying EBITDA Depreciation and amortisation Impairment losses Underlying EBIT Exceptional items Net finance costs Profit before taxation 3,3416 (1,719) (76) 1,546 ,522 (1,920) (213) 4,389 8,9304 (1,721) (14) 7,195 (539) ,397 (686) (29) 3,682 - (7) (242) (1) (250) (27) Directors' Report 23,183 (6,288) (333) 16,562 (566) (1,245) 14,751 656 2,428 1,074 409 412 (509) Capital expenditure (cash basis) Profit/(loss) from equity accounted investments, related impairments and expenses Investments accounted for using the equity method Total assets Total liabilities (4) 467 2491,335 12,938 26,824 4,886 3,145 2 192 883 12,257 2,404 1 6 37,766 37,000 147 ,473 111,993 51,323 22,208 3,888 Financial Statements BHP Ad Financial statements INCOME STATEMENT For the year ended 30 June 2018 Wesfarmers Consolidated RESTATED 2018 $m 2017 Note $m Continuing operations Revenue 66,883 64,913 Expenses Raw materials and inventory Employee benefits expense Freight and other related expenses Occupancy-related expenses Depreciation and amortisation Impairment expenses Other expenses Total expenses - NNNNN (45,718) (9,375) (757) (2,976) (1,198) (421) (2,757) (63,202) (44,633) (8,746) (857) (2,882) (1,175) (44) (2,832) (61,169) 286 Other income Share of net profits of associates and joint venture 283 97 380 147 433 Earnings before interest and income tax expense (EBIT) Finance costs 4,061 (211) 4,177 (248) Profit before income tax Income tax expense 3,850 (1,246) 2,604 3,929 (1,169) 2,760 Profit from continuing operations Discontinued operations Loss after tax for the year for Bunnings UK and Ireland Profit after tax for the year for Wesfarmers Curragh Pty Ltd (Loss)/profit after tax for the period from discontinued operations (1,657) 250 (1,407) (101) 214 113 Profit attributable to members of the parent 1,197 2.873 Earnings per share attributable to ordinary equity holders of the parent from continuing operations Basic earnings per share Diluted earnings per share cents 230.2 229.8 cents 244.7 244.2 Earnings per share attributable to ordinary equity holders of the parent Basic earnings per share Diluted earnings per share 105.8 105.6 254.7 254.2Step by Step Solution
There are 3 Steps involved in it
Step: 1

Get Instant Access to Expert-Tailored Solutions
See step-by-step solutions with expert insights and AI powered tools for academic success
Step: 2

Step: 3

Ace Your Homework with AI
Get the answers you need in no time with our AI-driven, step-by-step assistance
Get Started


