Answered step by step
Verified Expert Solution
Question
1 Approved Answer
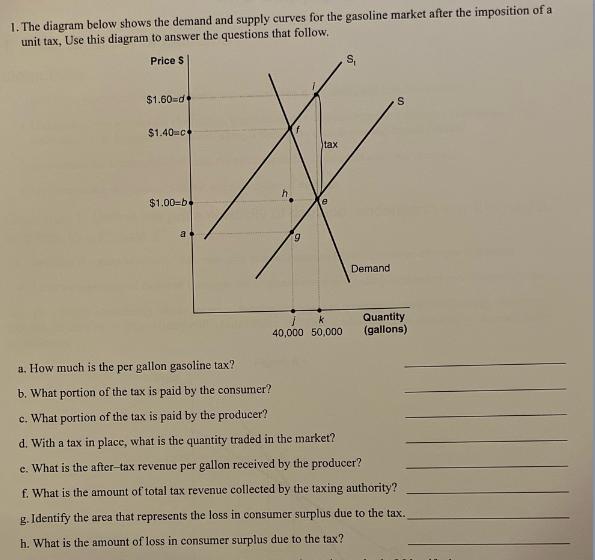
1. The diagram below shows the demand and supply curves for the gasoline market after the imposition of a unit tax, Use this diagram


1. The diagram below shows the demand and supply curves for the gasoline market after the imposition of a unit tax, Use this diagram to answer the questions that follow. Price $ $1.60-de $1.40=c+ $1.00-be n a 9 tax S Demand S k Quantity 40,000 50,000 (gallons) a. How much is the per gallon gasoline tax? b. What portion of the tax is paid by the consumer? c. What portion of the tax is paid by the producer? d. With a tax in place, what is the quantity traded in the market? c. What is the after-tax revenue per gallon received by the producer? f. What is the amount of total tax revenue collected by the taxing authority? g. Identify the area that represents the loss in consumer surplus due to the tax. h. What is the amount of loss in consumer surplus due to the tax? i. What portion of this loss in consumer surplus goes to the taxing authority? Identify the area. j. What is the producer surplus loss due to the tax? k. Identify the area and calculate the size of the deadweight loss due to the tax? 1. Is this tax efficient?
Step by Step Solution
There are 3 Steps involved in it
Step: 1
a How much is the per gallon gasoline tax From the diagram the per gallon tax is 020 b What portion ...
Get Instant Access to Expert-Tailored Solutions
See step-by-step solutions with expert insights and AI powered tools for academic success
Step: 2

Step: 3

Ace Your Homework with AI
Get the answers you need in no time with our AI-driven, step-by-step assistance
Get Started


