let me knoe if you need anything else!
blank 1: better/ worse
blank 2: better/ worse
blank 3: better/ worse
blank 4: better/ worse
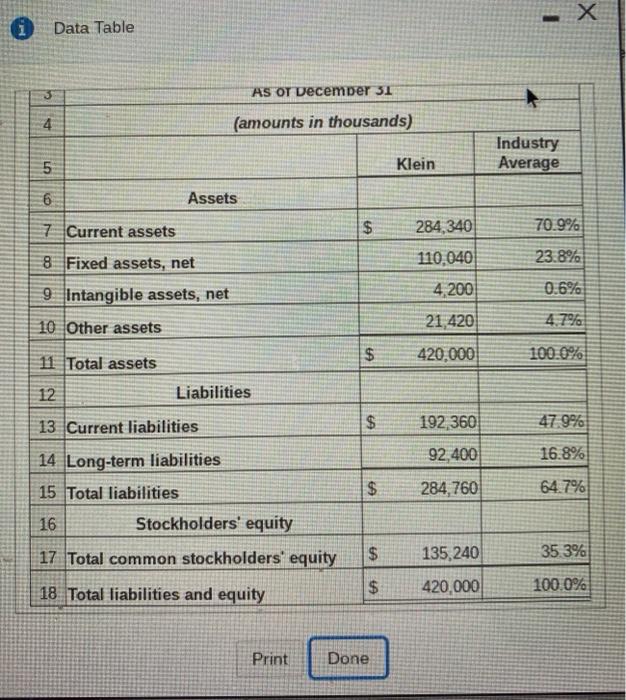
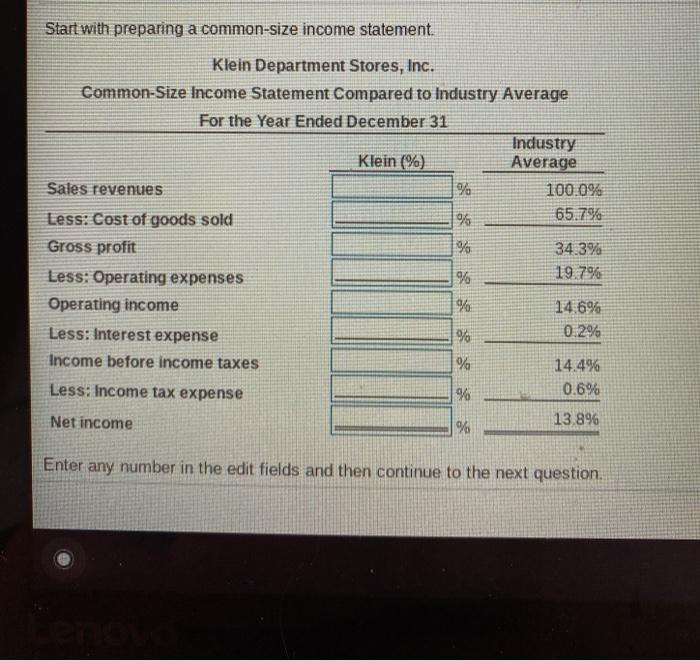
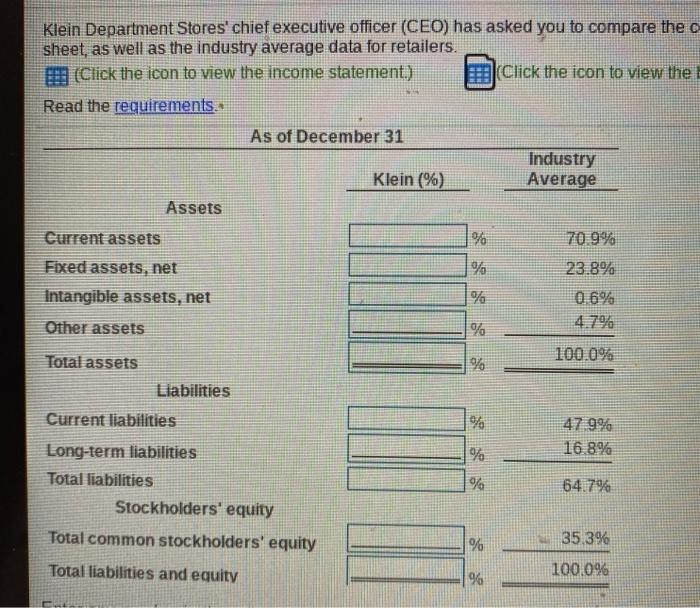
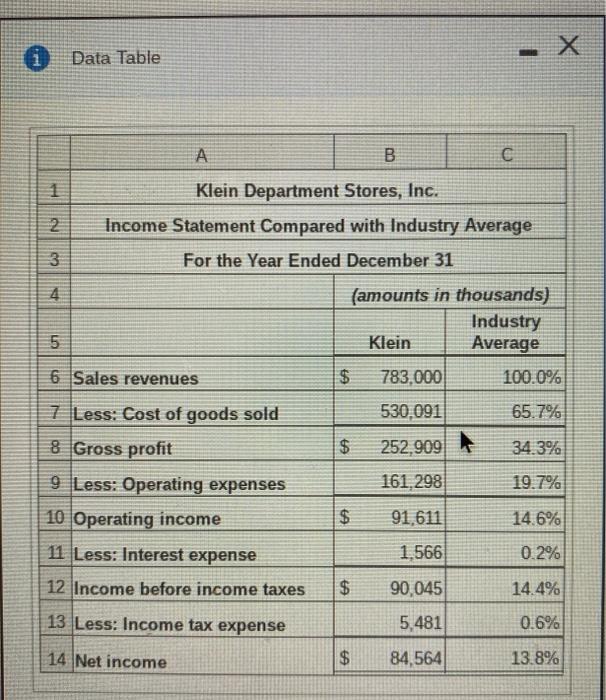
X i Data Table . B. C 1 2 3 4 on 1 Klein Department Stores, Inc. 2 Income Statement Compared with Industry Average 3. For the Year Ended December 31 4 (amounts in thousands) Industry 5 Klein Average 6 Sales revenues $ 783,000 100.0% 7 Less: Cost of goods sold 530.091 65.7% 8 Gross profit $ 252,909 34.3% 9 Less: Operating expenses 161,298 19.7% 10 Operating income 91,611 14.6% 11 Less: Interest expense 1,566 0.2% 12 Income before income taxes 90,045 14.4% 13 Less: Income tax expense 5,481 0.6% 14 Net income $ 84,564 13.8% $ $ Data Table AS OT December 31 4 (amounts in thousands) Industry Average LO Klein 6 Assets 7 Current assets $ 284,340 70.9% 8 Fixed assets, net 23.8% 0.6% 9 Intangible assets, net 110,040 4,200 21,420 420,000 4.7% 10 Other assets $ 100.0% 11 Total assets 12 Liabilities 13 Current liabilities $ $ 192,360 47.9% 92,400 16.8% $ 284,760 64.7% 14 Long-term liabilities 15 Total liabilities 16 Stockholders' equity 17 Total common stockholders' equity $ 135,240 35.3% $ 420,000 100.0% 18 Total liabilities and equity Print Done Start with preparing a common-size income statement. Klein Department Stores, Inc. Common-Size Income Statement Compared to Industry Average For the Year Ended December 31 Industry Klein (%) Average Sales revenues % 100.0% Less: Cost of goods sold % 65.7% Gross profit % 34.3% Less: Operating expenses % 19.7% Operating income % 14.6% Less: Interest expense % 0.2% Income before income taxes % 14.4% Less: Income tax expense % 0.6% Net income 13.8% % Enter any number in the edit fields and then continue to the next question. Klein Department Stores' chief executive officer (CEO) has asked you to compare the o sheet, as well as the industry average data for retailers. (Click the icon to view the income statement.) (Click the icon to view the Read the requirements.. As of December 31 Industry Klein (%) Average Assets Current assets 70.9% Fixed assets, net % 23.8% Intangible assets, net 06% Other assets % Total assets 100.0% Liabilities Current liabilities % 47.9% 16.8% % % 64.7% Long-term liabilities Total liabilities Stockholders' equity Total common stockholders' equity % 35.3% Total liabilities and equity 100.0% % Requirement 2. For the profitability analysis, compute Klein Department Stores a rate of gross profil to sales. (b) ratio of operating income was, and (cratio of income to sales Compare these with the dusty averages is klein Department Stores profit performance better or worse than the industry average Kis common se income statement shows that its ration of gross proft, operating income, and net income to sale we than the industry averages. Overal Kin's profit performance is average for the industry Requirement 3. For the analysis of financial position, compute Klein Department Stores (a) ratio of current stato totalets and (b) ratio of stockholders' equity to total assets Compare these mats with industry averages is klein Department Stores financial position better or worse than the industry averages Klin's common se balance sheet shows that its ratio of current assets to total assets and state of stockholders' equity to totales are than average for the industry than the industry averages. Overall low's financial pout IS


