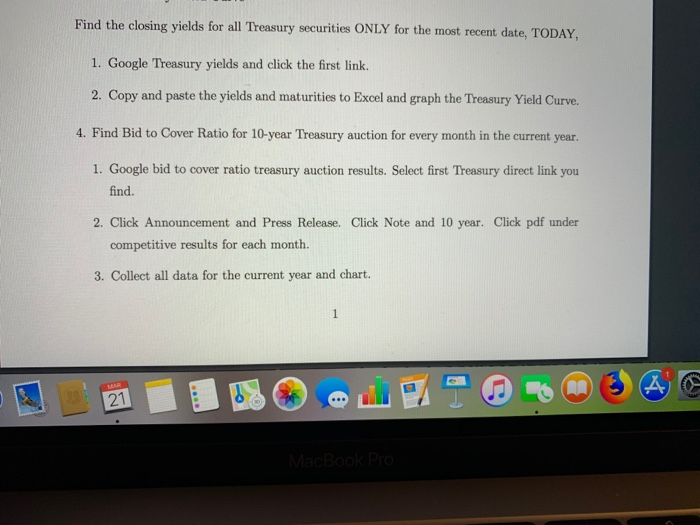
LINE BEA kmarks People Tab Window Help Project Exercise 2.pdf X + Downloads/Project%20Exercise%202.pdf 1 Project Exercise 2 1. Find Fed monetary base. 1. Google Monetary Base Fed. Click on first link. Click Monthly Non-Seasonally Ad- justed. Download from 1984 to most recent date. 2. Google excess reserved Fed. Download from 1984 to most recent date. 3. Make sure each time series uses the same units. Subtract the two and Graph. 2. Find Baa-Ana spread. Baa and Aaa bonds are corporate bonds. Baa is lower quality and Aaa is higher quality 1. Google Baa Fed. Click first link and download data from 1970 to most recent date. Use monthly data 2. Do the same for Aaa Fed. 3. Subtract the two and graph. 4. Subtract the two and divide by the Aaa yield and graph. 3. Find Treasury Yield Curve Find the closing yields for all Treasury securities ONLY for the most recent date, TODAY, 1. Google Treasury yields and click the first link. 2. Copy and paste the yields and maturities to Excel and graph the Treasury Yield Curve. 4. Find Bid to Cover Ratio for 10-year Treasury auction for every month in the current year. Find the closing yields for all Treasury securities ONLY for the most recent date, TODAY, 1. Google Treasury yields and click the first link. 2. Copy and paste the yields and maturities to Excel and graph the Treasury Yield Curve. 4. Find Bid to Cover Ratio for 10-year Treasury auction for every month in the current year. 1. Google bid to cover ratio treasury auction results. Select first Treasury direct link you find. 2. Click Announcement and Press Release. Click Note and 10 year. Click pdf under competitive results for each month. 3. Collect all data for the current year and chart. 1 A 2 21 MacBook Pro LINE BEA kmarks People Tab Window Help Project Exercise 2.pdf X + Downloads/Project%20Exercise%202.pdf 1 Project Exercise 2 1. Find Fed monetary base. 1. Google Monetary Base Fed. Click on first link. Click Monthly Non-Seasonally Ad- justed. Download from 1984 to most recent date. 2. Google excess reserved Fed. Download from 1984 to most recent date. 3. Make sure each time series uses the same units. Subtract the two and Graph. 2. Find Baa-Ana spread. Baa and Aaa bonds are corporate bonds. Baa is lower quality and Aaa is higher quality 1. Google Baa Fed. Click first link and download data from 1970 to most recent date. Use monthly data 2. Do the same for Aaa Fed. 3. Subtract the two and graph. 4. Subtract the two and divide by the Aaa yield and graph. 3. Find Treasury Yield Curve Find the closing yields for all Treasury securities ONLY for the most recent date, TODAY, 1. Google Treasury yields and click the first link. 2. Copy and paste the yields and maturities to Excel and graph the Treasury Yield Curve. 4. Find Bid to Cover Ratio for 10-year Treasury auction for every month in the current year. Find the closing yields for all Treasury securities ONLY for the most recent date, TODAY, 1. Google Treasury yields and click the first link. 2. Copy and paste the yields and maturities to Excel and graph the Treasury Yield Curve. 4. Find Bid to Cover Ratio for 10-year Treasury auction for every month in the current year. 1. Google bid to cover ratio treasury auction results. Select first Treasury direct link you find. 2. Click Announcement and Press Release. Click Note and 10 year. Click pdf under competitive results for each month. 3. Collect all data for the current year and chart. 1 A 2 21 MacBook Pro


