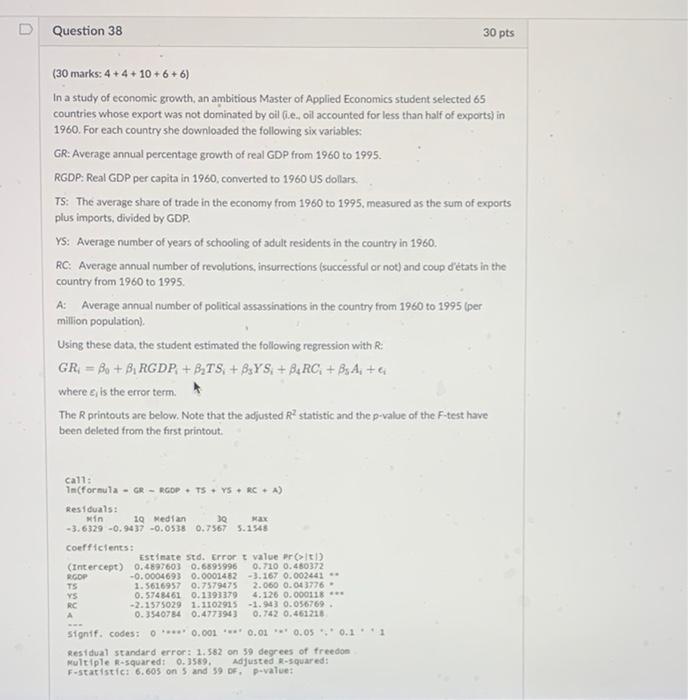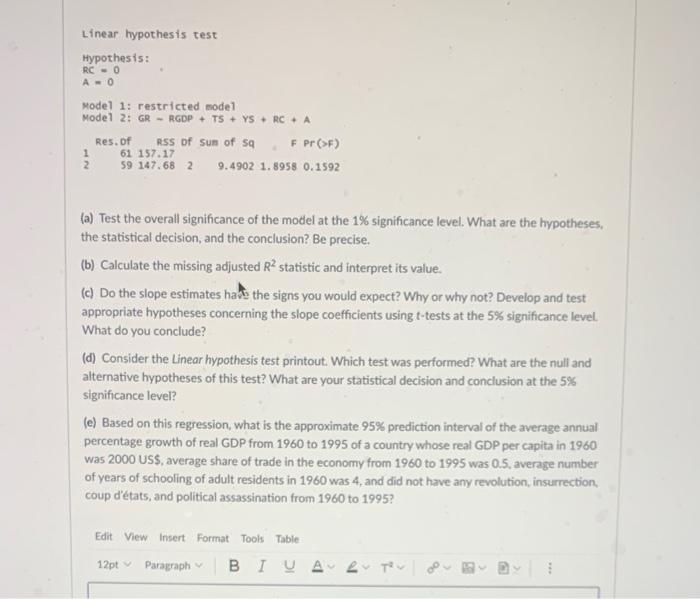
Linear hypothesis test Hypothesis: RC-0 A-0 Model 1: restricted model Model 2: GR - RGDP+ TS+ YSRC+ A Res. of RSS of sum of Sq F Pr (>F) 1 61 157.17 2 59 147.68 2 9.4902 1.8958 0.1592 (a) Test the overall significance of the model at the 1% significance level. What are the hypotheses, the statistical decision, and the conclusion? Be precise. (b) Calculate the missing adjusted R statistic and interpret its value. (c) Do the slope estimates have the signs you would expect? Why or why not? Develop and test appropriate hypotheses concerning the slope coefficients using t-tests at the 5% significance level. What do you conclude? (d) Consider the Linear hypothesis test printout. Which test was performed? What are the null and alternative hypotheses of this test? What are your statistical decision and conclusion at the 5% significance level? (e) Based on this regression, what is the approximate 95% prediction interval of the average annual percentage growth of real GDP from 1960 to 1995 of a country whose real GDP per capita in 1960 was 2000 US$, average share of trade in the economy from 1960 to 1995 was 0.5, average number of years of schooling of adult residents in 1960 was 4, and did not have any revolution, insurrection, coup d'tats, and political assassination from 1960 to 1995? Edit View Insert Format Tools Table 12pt Paragraph BIUA 2 TU www Question 38 30 pts (30 marks: 4 + 4 + 10 +6+6) In a study of economic growth, an ambitious Master of Applied Economics student selected 65 countries whose export was not dominated by oil (i.e., oil accounted for less than half of exports) in 1960. For each country she downloaded the following six variables: GR: Average annual percentage growth of real GDP from 1960 to 1995. RGDP: Real GDP per capita in 1960, converted to 1960 US dollars. TS: The average share of trade in the economy from 1960 to 1995, measured as the sum of exports plus imports, divided by GDP. YS: Average number of years of schooling of adult residents in the country in 1960. RC: Average annual number of revolutions, insurrections (successful or not) and coup d'tats in the country from 1960 to 1995. A: Average annual number of political assassinations in the country from 1960 to 1995 (per million population). Using these data, the student estimated the following regression with R. GR=B+B RGDP,+BTS,+BYS; + B RC + Bs A+ where e, is the error term. The R printouts are below. Note that the adjusted R statistic and the p-value of the F-test have been deleted from the first printout. call: In(formula GRRGOP+ TSYS RCA) Residuals: xin 10 Median 3Q Max -3.6329 -0.9437 -0.0538 0.7567 5.1548 coefficients: Estimate std. Error t value pr(it) (Intercept) 0.4897603 0.6895996 0.710 0.480372 RGOP -0.0004693 0.0001482 -3.167 0.002441 ** TS 1.5616957 0.7579475 2.060 0.043776 YS RC 0.5748461 0.1393379 4.126 0.000118 *** -2.1575029 1.1102915 -1.943 0.056769. 0.3540784 0.4773943 0.742 0.461218 A signif. codes: 0 0.001 Residual standard error: 1.582 on 59 degrees of freedom Multiple R-squared: 0.3589, Adjusted R-squared: F-statistic: 6.605 on 5 and 59 DF, p-value: 0.01 0.05 0.11 Linear hypothesis test Hypothesis: RC-0 A-0 Model 1: restricted model Model 2: GR - RGDP+ TS+ YSRC+ A Res. of RSS of sum of Sq F Pr (>F) 1 61 157.17 2 59 147.68 2 9.4902 1.8958 0.1592 (a) Test the overall significance of the model at the 1% significance level. What are the hypotheses, the statistical decision, and the conclusion? Be precise. (b) Calculate the missing adjusted R statistic and interpret its value. (c) Do the slope estimates have the signs you would expect? Why or why not? Develop and test appropriate hypotheses concerning the slope coefficients using t-tests at the 5% significance level. What do you conclude? (d) Consider the Linear hypothesis test printout. Which test was performed? What are the null and alternative hypotheses of this test? What are your statistical decision and conclusion at the 5% significance level? (e) Based on this regression, what is the approximate 95% prediction interval of the average annual percentage growth of real GDP from 1960 to 1995 of a country whose real GDP per capita in 1960 was 2000 US$, average share of trade in the economy from 1960 to 1995 was 0.5, average number of years of schooling of adult residents in 1960 was 4, and did not have any revolution, insurrection, coup d'tats, and political assassination from 1960 to 1995? Edit View Insert Format Tools Table 12pt Paragraph BIUA 2 TU www Question 38 30 pts (30 marks: 4 + 4 + 10 +6+6) In a study of economic growth, an ambitious Master of Applied Economics student selected 65 countries whose export was not dominated by oil (i.e., oil accounted for less than half of exports) in 1960. For each country she downloaded the following six variables: GR: Average annual percentage growth of real GDP from 1960 to 1995. RGDP: Real GDP per capita in 1960, converted to 1960 US dollars. TS: The average share of trade in the economy from 1960 to 1995, measured as the sum of exports plus imports, divided by GDP. YS: Average number of years of schooling of adult residents in the country in 1960. RC: Average annual number of revolutions, insurrections (successful or not) and coup d'tats in the country from 1960 to 1995. A: Average annual number of political assassinations in the country from 1960 to 1995 (per million population). Using these data, the student estimated the following regression with R. GR=B+B RGDP,+BTS,+BYS; + B RC + Bs A+ where e, is the error term. The R printouts are below. Note that the adjusted R statistic and the p-value of the F-test have been deleted from the first printout. call: In(formula GRRGOP+ TSYS RCA) Residuals: xin 10 Median 3Q Max -3.6329 -0.9437 -0.0538 0.7567 5.1548 coefficients: Estimate std. Error t value pr(it) (Intercept) 0.4897603 0.6895996 0.710 0.480372 RGOP -0.0004693 0.0001482 -3.167 0.002441 ** TS 1.5616957 0.7579475 2.060 0.043776 YS RC 0.5748461 0.1393379 4.126 0.000118 *** -2.1575029 1.1102915 -1.943 0.056769. 0.3540784 0.4773943 0.742 0.461218 A signif. codes: 0 0.001 Residual standard error: 1.582 on 59 degrees of freedom Multiple R-squared: 0.3589, Adjusted R-squared: F-statistic: 6.605 on 5 and 59 DF, p-value: 0.01 0.05 0.11