

Answered step by step
Verified Expert Solution
Question
1 Approved Answer
****LINK TO DATA**** https://www42.zippyshare.com/v/kZWrVmuR/file.html Problem I: This problem is based on the Bridge Construction dataset on the textbook website (bridge.txt).Before construction begins, a bridge project
****LINK TO DATA****
https://www42.zippyshare.com/v/kZWrVmuR/file.html
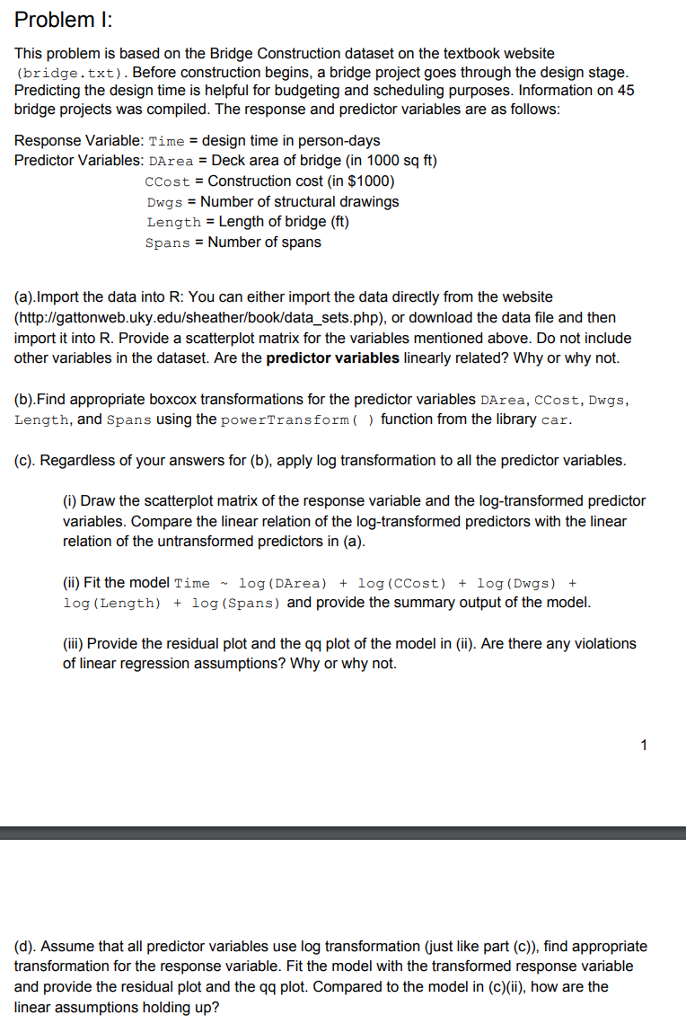
Problem I: This problem is based on the Bridge Construction dataset on the textbook website (bridge.txt).Before construction begins, a bridge project goes through the design stage Predicting the design time is helpful for budgeting and scheduling purposes. Information on 45 bridge projects was compiled. The response and predictor variables are as follows Response Variable: Time design time in person-days Predictor Variables: DArea Deck area of bridge (in 1000 sq ft) CCost Construction cost (in $1000) DwgsNumber of structural drawings Length - Length of bridge (ft) Spans Number of spans (a).lmport the data into R: You can either import the data directly from the website (http://gattonweb.uky.edu/sheather/book/data_sets.php), or download the data file and then import it into R. Provide a scatterplot matrix for the variables mentioned above. Do not include other variables in the dataset. Are the predictor variables linearly related? Why or why not. (b).Find appropriate boxcox transformations for the predictor variables DArea, CCost, Dwgs, Length, and Spans using the powerTransform( function from the library ca:r (c). Regardless of your answers for (b), apply log transformation to all the predictor variables (i) Draw the scatterplot matrix of the response variable and the log-transformed predictor variables. Compare the linear relation of the log-transformed predictors with the linear relation of the untransformed predictors in (a) (ii) Fit the model Time log (DArea) log (CCost) +log (Dwgs)+ log (Length) log (Spans) and provide the summary output of the model (ii) Provide the residual plot and the qq plot of the model in (ii). Are there any violations of linear regression assumptions? Why or why not. (d). Assume that all predictor variables use log transformation (just like part (c)), find appropriate transformation for the response variable. Fit the model with the transformed response variable and provide the residual plot and the qq plot. Compared to the model in (c)(ii), how are the linear assumptions holding up? Problem I: This problem is based on the Bridge Construction dataset on the textbook website (bridge.txt).Before construction begins, a bridge project goes through the design stage Predicting the design time is helpful for budgeting and scheduling purposes. Information on 45 bridge projects was compiled. The response and predictor variables are as follows Response Variable: Time design time in person-days Predictor Variables: DArea Deck area of bridge (in 1000 sq ft) CCost Construction cost (in $1000) DwgsNumber of structural drawings Length - Length of bridge (ft) Spans Number of spans (a).lmport the data into R: You can either import the data directly from the website (http://gattonweb.uky.edu/sheather/book/data_sets.php), or download the data file and then import it into R. Provide a scatterplot matrix for the variables mentioned above. Do not include other variables in the dataset. Are the predictor variables linearly related? Why or why not. (b).Find appropriate boxcox transformations for the predictor variables DArea, CCost, Dwgs, Length, and Spans using the powerTransform( function from the library ca:r (c). Regardless of your answers for (b), apply log transformation to all the predictor variables (i) Draw the scatterplot matrix of the response variable and the log-transformed predictor variables. Compare the linear relation of the log-transformed predictors with the linear relation of the untransformed predictors in (a) (ii) Fit the model Time log (DArea) log (CCost) +log (Dwgs)+ log (Length) log (Spans) and provide the summary output of the model (ii) Provide the residual plot and the qq plot of the model in (ii). Are there any violations of linear regression assumptions? Why or why not. (d). Assume that all predictor variables use log transformation (just like part (c)), find appropriate transformation for the response variable. Fit the model with the transformed response variable and provide the residual plot and the qq plot. Compared to the model in (c)(ii), how are the linear assumptions holding up
Step by Step Solution
There are 3 Steps involved in it
Step: 1

Get Instant Access to Expert-Tailored Solutions
See step-by-step solutions with expert insights and AI powered tools for academic success
Step: 2

Step: 3
Ace Your Homework with AI
Get the answers you need in no time with our AI-driven, step-by-step assistance
Get Started
Parallel Database Systems Prisma Workshop Noordwijk The Netherlands September 24 26 1990 Proceedings Lncs 503
Authors: Pierre America
1st Edition
0387541322, 978-0387541327