

Question
Liquid water at P=200kPa is heated isobarically from T=20deg C to T=200deg C . Your task is to decide how this process should be illustrated
Liquid water at
P=200kPais heated isobarically from
T=20\\\\deg Cto
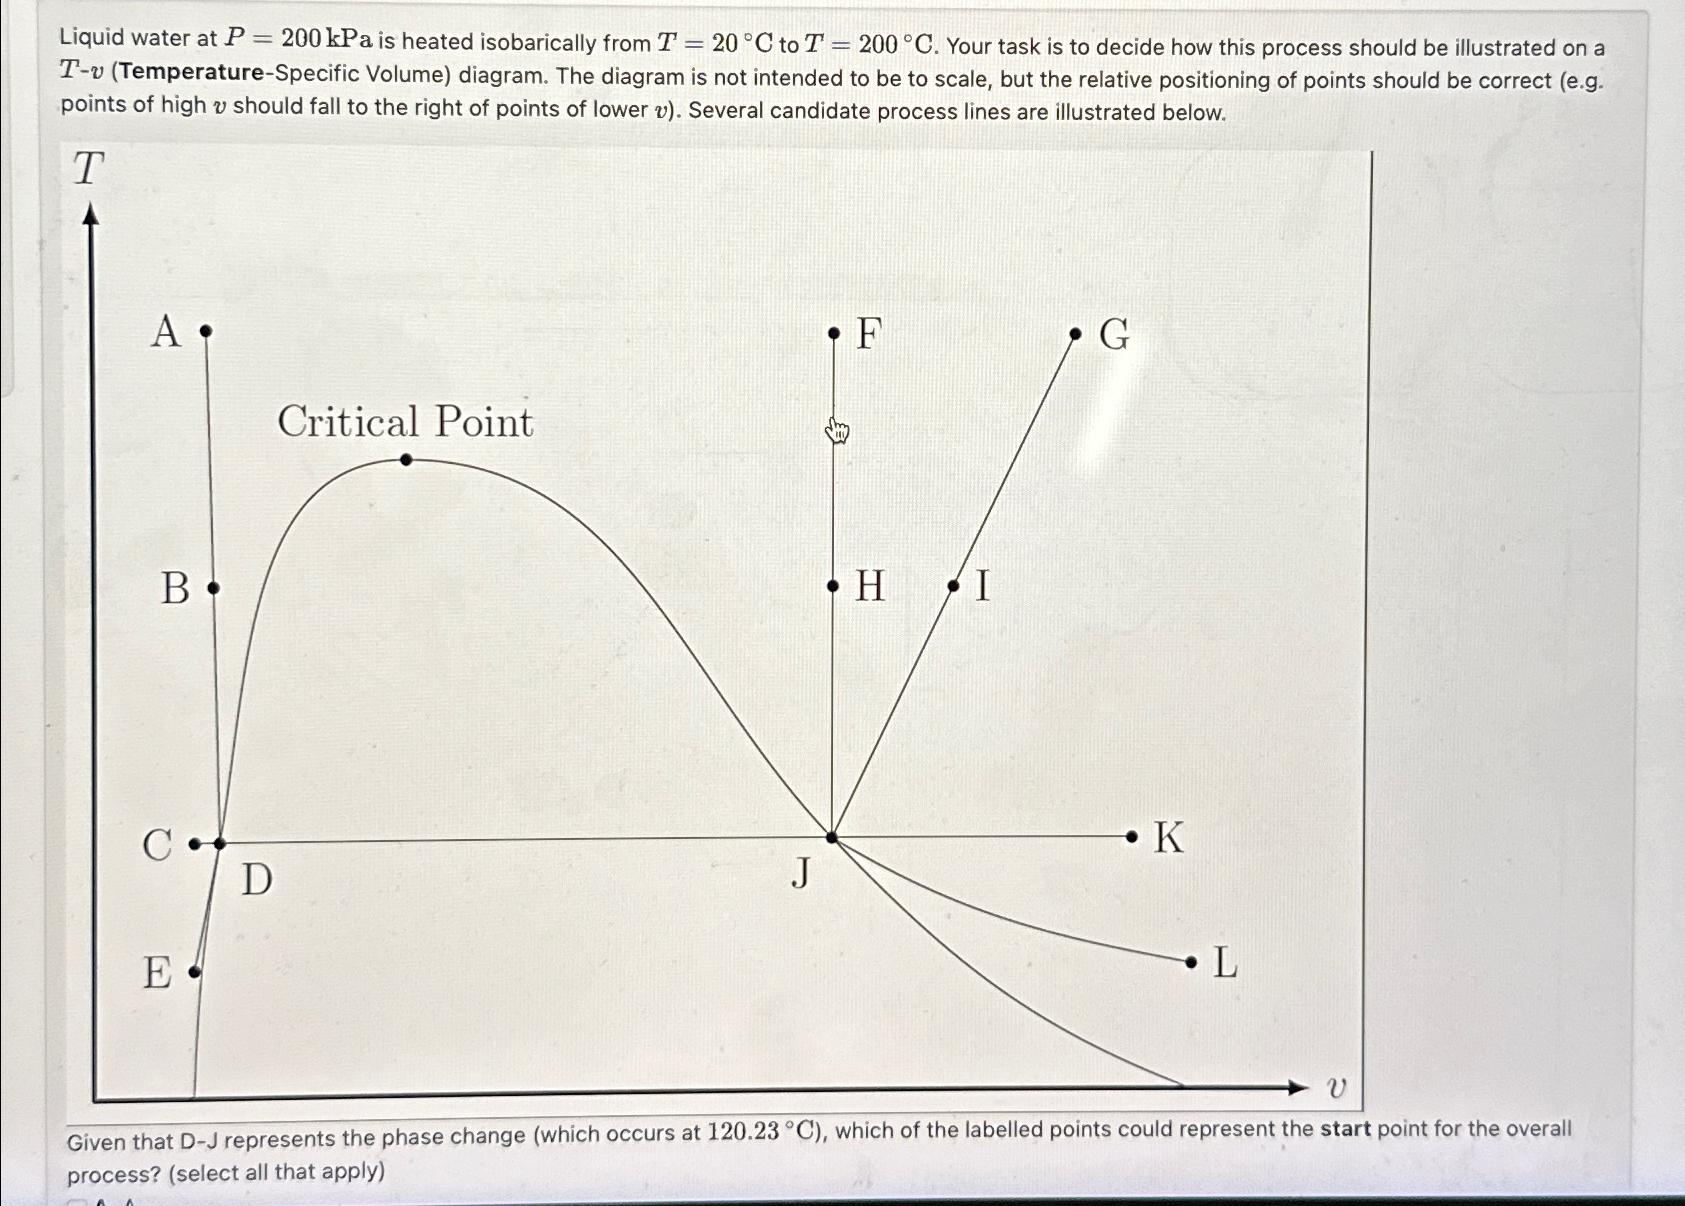
T=200\\\\deg C. Your task is to decide how this process should be illustrated on a
T-v(Temperature-Specific Volume) diagram. The diagram is not intended to be to scale, but the relative positioning of points should be correct (e.g. points of high
vshould fall to the right of points of lower
v). Several candidate process lines are illustrated below.\ Given that D-J represents the phase change (which occurs at
120.23\\\\deg C), which of the labelled points could represent the start point for the overall process? (select all that apply)
Step by Step Solution
There are 3 Steps involved in it
Step: 1

Get Instant Access to Expert-Tailored Solutions
See step-by-step solutions with expert insights and AI powered tools for academic success
Step: 2

Step: 3
Ace Your Homework with AI
Get the answers you need in no time with our AI-driven, step-by-step assistance
Get Started
Introduction To Chemical Engineering Thermodynamics
Authors: J.M. Smith, Mark Swihart Hendrick C. Van Ness, Michael Abbott
9th International Edition
1260597687, 978-1260597684