

Answered step by step
Verified Expert Solution
Question
1 Approved Answer
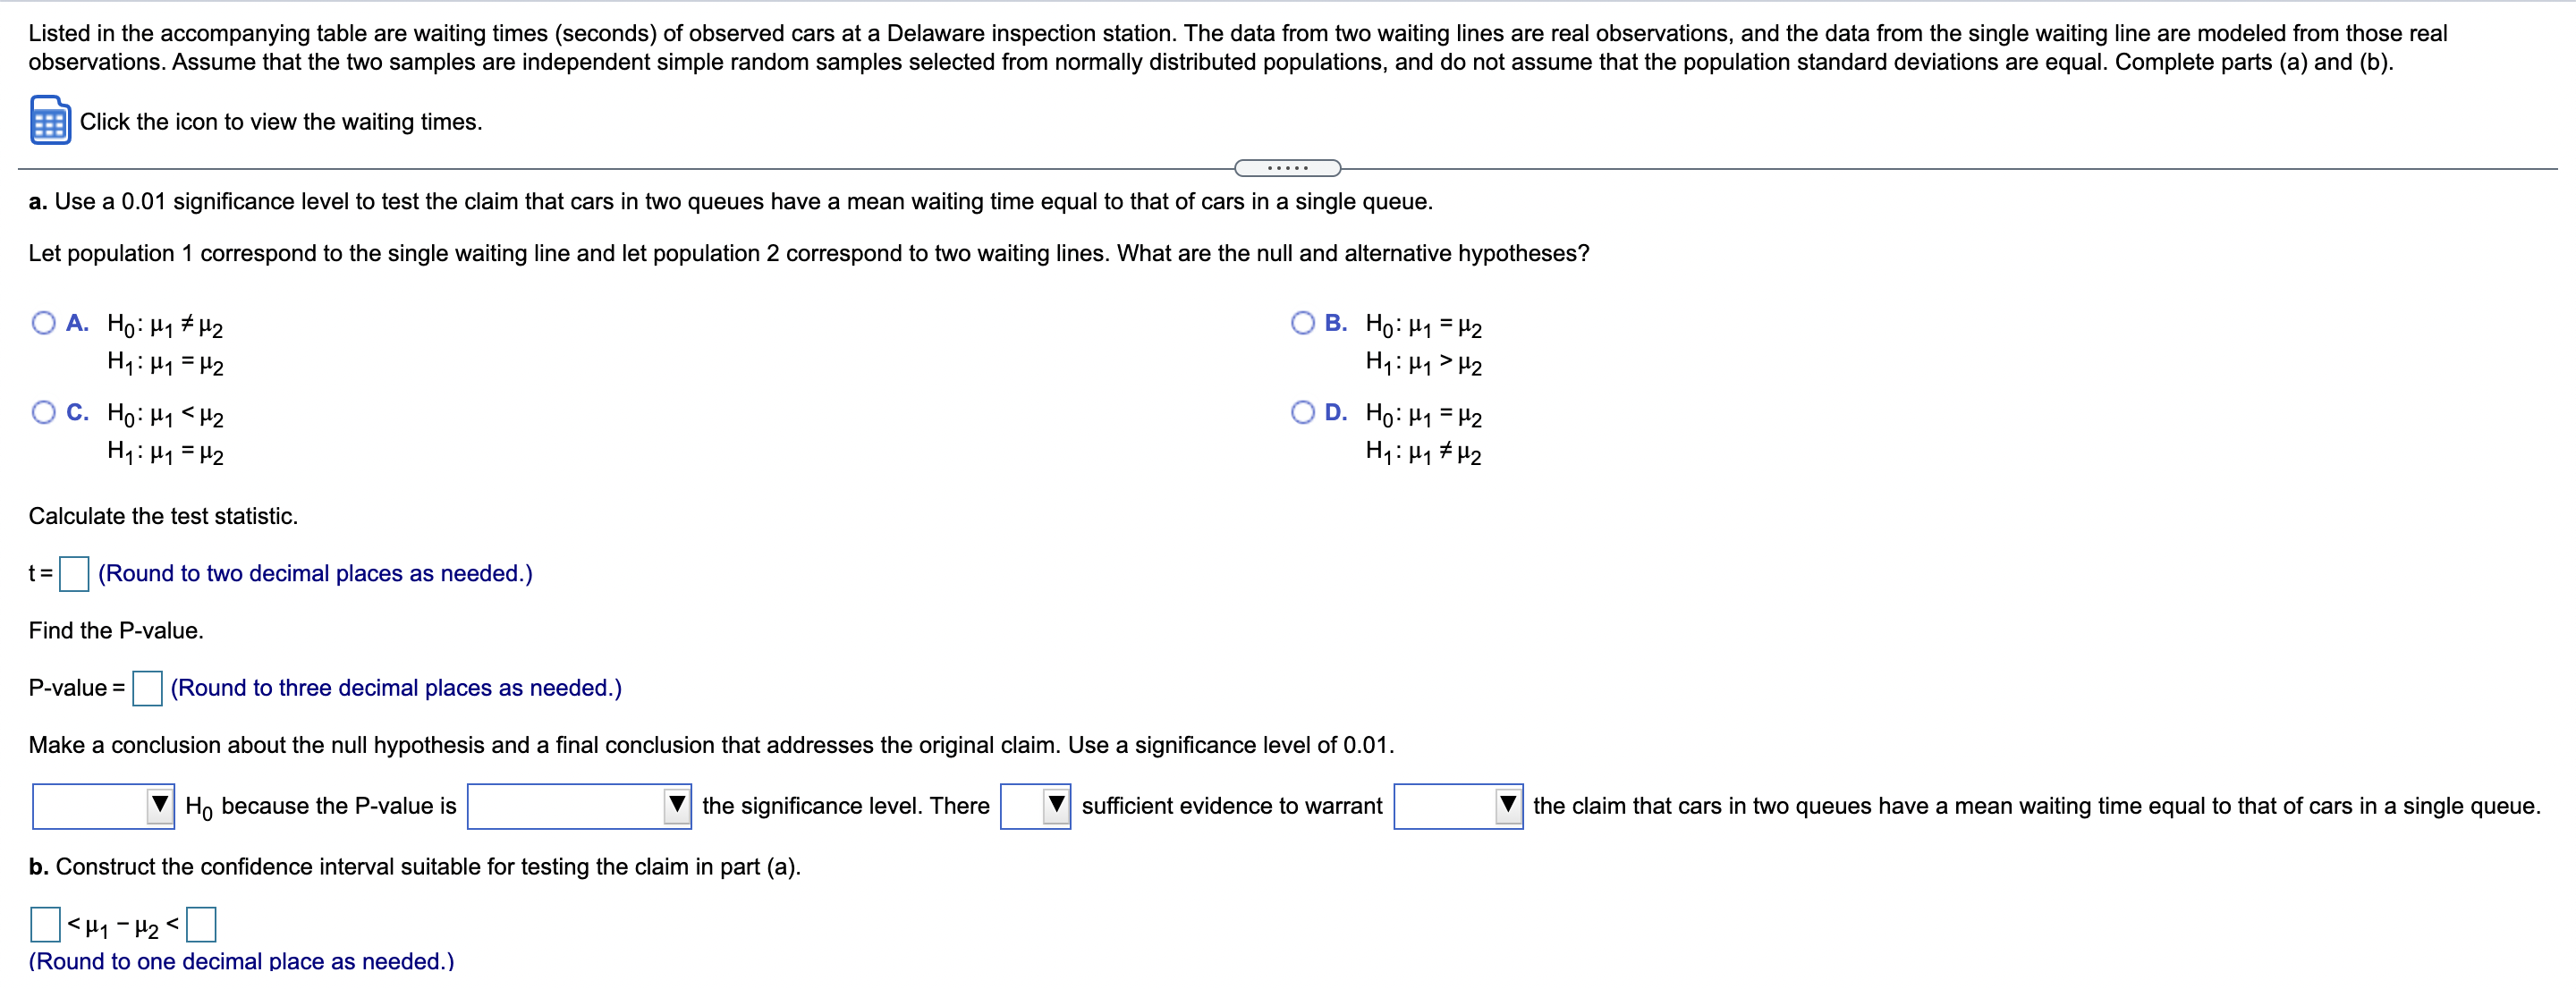
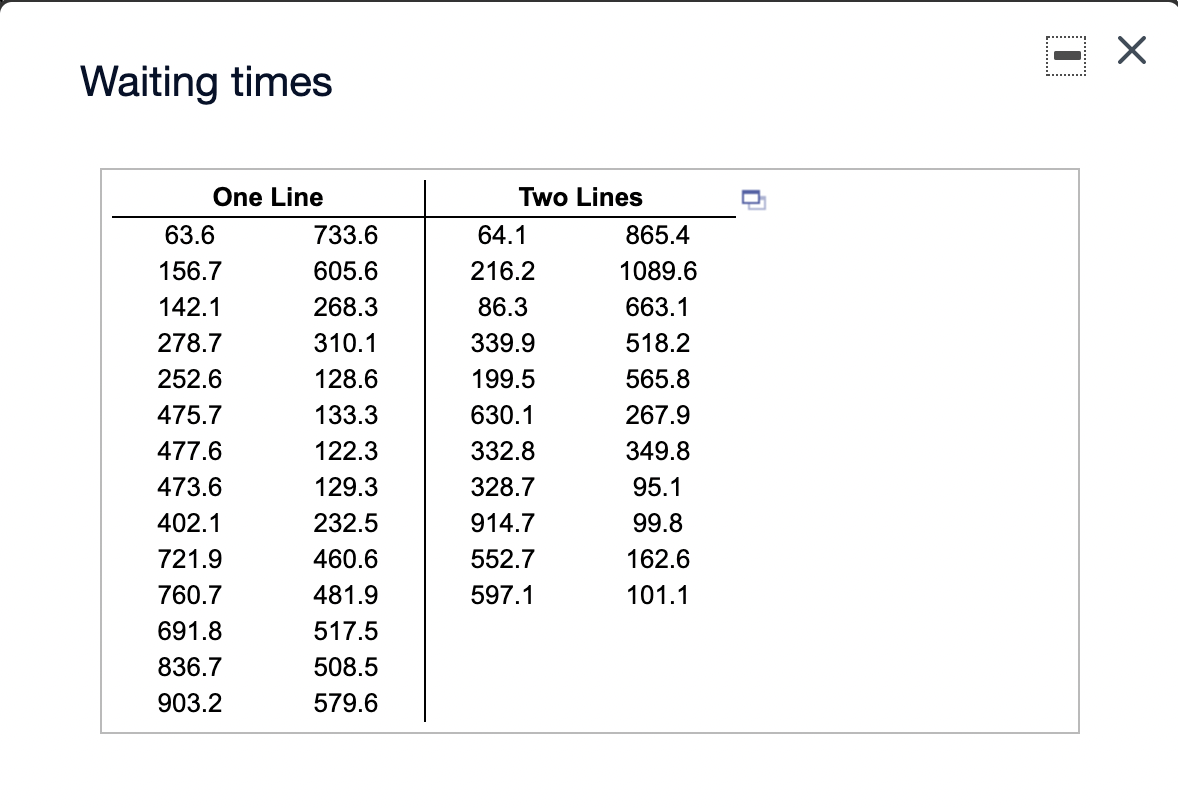
Listed in the accompanying table are waiting times (seconds) of observed cars at a Delaware inspection station. The data from two waiting lines are real


Step by Step Solution
There are 3 Steps involved in it
Step: 1

Get Instant Access to Expert-Tailored Solutions
See step-by-step solutions with expert insights and AI powered tools for academic success
Step: 2

Step: 3
Ace Your Homework with AI
Get the answers you need in no time with our AI-driven, step-by-step assistance
Get Started
Mathematical Analysis For Quantitative Finance
Authors: Daniele Ritelli, Giulia Spaletta
1st Edition
1351245104, 9781351245104