

Question: look at the three last pics, its clear, do not look at the first three pics there are clear pics on the last three pics,
look at the three last pics, its clear, do not look at the first three pics
there are clear pics on the last three pics, please zoom and you will see it
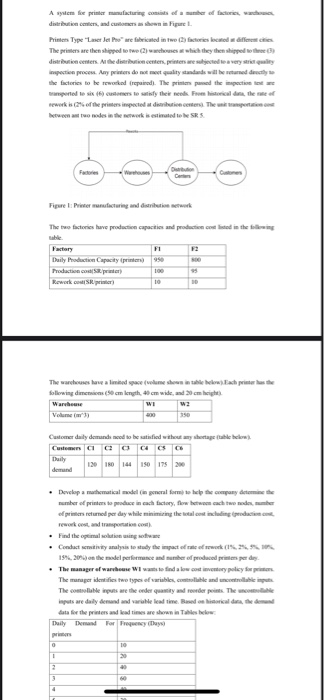
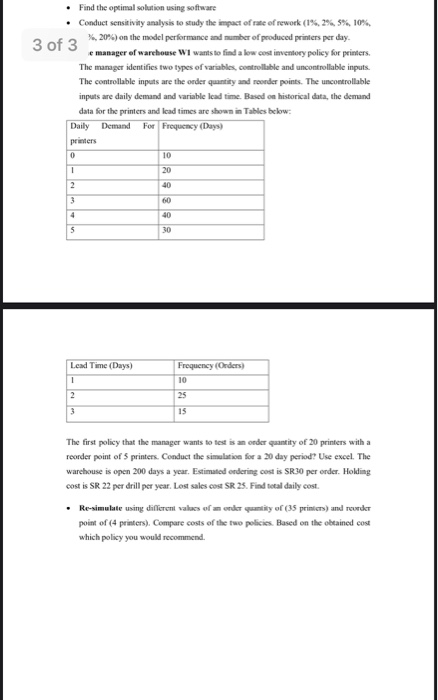
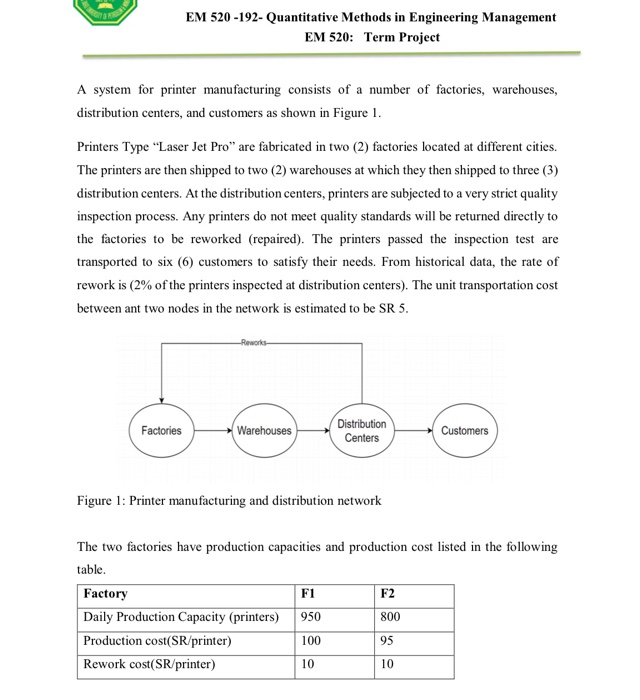
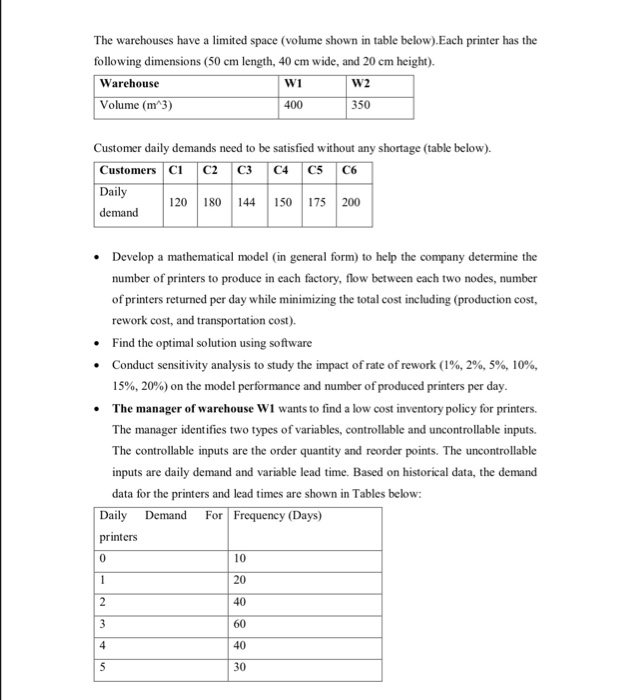
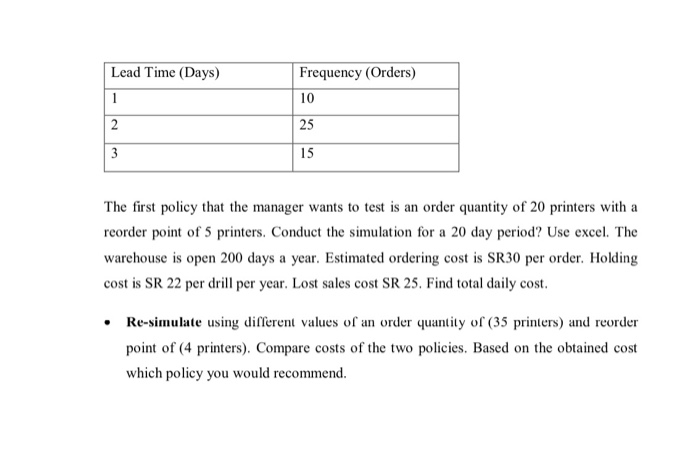
distribut i on, and shown in Figure The p ressed to www why the disnes Althediscentes, pe r the factors to be wor h the a ch The war indic we aldeve dhew am o m wide .com The The Find the optimal solution using software Conduct sensitivity analysis to study the impact of rate of rework (1% 2% 3% 10% %,20%) on the model performance and e r of produced printers per day 3 of 3 e manager of warehouse W1 wants to find a low cost inventory policy for printers The manager identifies two types of variables. Com e and controllable inputs The controllable inputs are the order quantity and render points. The controllable inputs are daily demand and variable lead time. Based on historical data, the demand data for the printers and lead times are shown in Tabies below: Daily Demand for Frequency (Days) pres Lend Time (Days) Frequency (Orders) The first policy that the manager wants to test is an order quantity of 20 printers with a reorder point of printers. Conduct the simulation for a 20 day period? Use excel. The warchouse is open 200 days a year. Estimated ordering cost is SR30 per order. Holding cost is SR 22 per drill per year. Lost sales cost SR 25. Find total daily cost Resimale using different was o n e of (35 primis) and onder point of (4 printers). Compare costs of the two policies. Based on the obtained cost which policy you would recommend EM 520-192- Quantitative Methods in Engineering Management EM 520: Term Project A system for printer manufacturing consists of a number of factories, warehouses, distribution centers, and customers as shown in Figure 1. Printers Type "Laser Jet Pro" are fabricated in two (2) factories located at different cities. The printers are then shipped to two (2) warehouses at which they then shipped to three (3) distribution centers. At the distribution centers, printers are subjected to a very strict quality inspection process. Any printers do not meet quality standards will be returned directly to the factories to be reworked (repaired). The printers passed the inspection test are transported to six (6) customers to satisfy their needs. From historical data, the rate of rework is (2% of the printers inspected at distribution centers). The unit transportation cost between ant two nodes in the network is estimated to be SR 5. -Reworks Factories Warehouses Distribution Centers Customers Figure 1: Printer manufacturing and distribution network F2 The two factories have production capacities and production cost listed in the following table. Factory F1 Daily Production Capacity (printers) 950 800 Production cost(SR/printer) 100 Rework cost(SR/printer) 10 The warehouses have a limited space (volume shown in table below).Each printer has the following dimensions (50 cm length, 40 cm wide, and 20 cm height). Warehouse W1 Volume (m 3) 400 350 W2 Customer daily demands need to be satisfied without any shortage (table below). Customers c1 C2 C3 C4 C5 C6 Daily 120 180 144 150 175 200 demand Develop a mathematical model (in general form) to help the company determine the number of printers to produce in each factory, flow between each two nodes, number of printers returned per day while minimizing the total cost including (production cost, rework cost, and transportation cost). Find the optimal solution using software Conduct sensitivity analysis to study the impact of rate of rework (1%, 2%, 5%, 10%, 15%, 20%) on the model performance and number of produced printers per day. The manager of warehouse W1 wants to find a low cost inventory policy for printers. The manager identifies two types of variables, controllable and uncontrollable inputs. The controllable inputs are the order quantity and reorder points. The uncontrollable inputs are daily demand and variable lead time. Based on historical data, the demand data for the printers and lead times are shown in Tables below: Daily Demand For Frequency (Days) printers Lead Time (Days) Frequency (Orders) 25 15 The first policy that the manager wants to test is an order quantity of 20 printers with a reorder point of 5 printers. Conduct the simulation for a 20 day period? Use excel. The warehouse is open 200 days a year. Estimated ordering cost is SR30 per order. Holding cost is SR 22 per drill per year. Lost sales cost SR 25. Find total daily cost. Re-simulate using different values of an order quantity of (35 printers) and reorder point of (4 printers). Compare costs of the two policies. Based on the obtained cost which policy you would recommend. distribut i on, and shown in Figure The p ressed to www why the disnes Althediscentes, pe r the factors to be wor h the a ch The war indic we aldeve dhew am o m wide .com The The Find the optimal solution using software Conduct sensitivity analysis to study the impact of rate of rework (1% 2% 3% 10% %,20%) on the model performance and e r of produced printers per day 3 of 3 e manager of warehouse W1 wants to find a low cost inventory policy for printers The manager identifies two types of variables. Com e and controllable inputs The controllable inputs are the order quantity and render points. The controllable inputs are daily demand and variable lead time. Based on historical data, the demand data for the printers and lead times are shown in Tabies below: Daily Demand for Frequency (Days) pres Lend Time (Days) Frequency (Orders) The first policy that the manager wants to test is an order quantity of 20 printers with a reorder point of printers. Conduct the simulation for a 20 day period? Use excel. The warchouse is open 200 days a year. Estimated ordering cost is SR30 per order. Holding cost is SR 22 per drill per year. Lost sales cost SR 25. Find total daily cost Resimale using different was o n e of (35 primis) and onder point of (4 printers). Compare costs of the two policies. Based on the obtained cost which policy you would recommend EM 520-192- Quantitative Methods in Engineering Management EM 520: Term Project A system for printer manufacturing consists of a number of factories, warehouses, distribution centers, and customers as shown in Figure 1. Printers Type "Laser Jet Pro" are fabricated in two (2) factories located at different cities. The printers are then shipped to two (2) warehouses at which they then shipped to three (3) distribution centers. At the distribution centers, printers are subjected to a very strict quality inspection process. Any printers do not meet quality standards will be returned directly to the factories to be reworked (repaired). The printers passed the inspection test are transported to six (6) customers to satisfy their needs. From historical data, the rate of rework is (2% of the printers inspected at distribution centers). The unit transportation cost between ant two nodes in the network is estimated to be SR 5. -Reworks Factories Warehouses Distribution Centers Customers Figure 1: Printer manufacturing and distribution network F2 The two factories have production capacities and production cost listed in the following table. Factory F1 Daily Production Capacity (printers) 950 800 Production cost(SR/printer) 100 Rework cost(SR/printer) 10 The warehouses have a limited space (volume shown in table below).Each printer has the following dimensions (50 cm length, 40 cm wide, and 20 cm height). Warehouse W1 Volume (m 3) 400 350 W2 Customer daily demands need to be satisfied without any shortage (table below). Customers c1 C2 C3 C4 C5 C6 Daily 120 180 144 150 175 200 demand Develop a mathematical model (in general form) to help the company determine the number of printers to produce in each factory, flow between each two nodes, number of printers returned per day while minimizing the total cost including (production cost, rework cost, and transportation cost). Find the optimal solution using software Conduct sensitivity analysis to study the impact of rate of rework (1%, 2%, 5%, 10%, 15%, 20%) on the model performance and number of produced printers per day. The manager of warehouse W1 wants to find a low cost inventory policy for printers. The manager identifies two types of variables, controllable and uncontrollable inputs. The controllable inputs are the order quantity and reorder points. The uncontrollable inputs are daily demand and variable lead time. Based on historical data, the demand data for the printers and lead times are shown in Tables below: Daily Demand For Frequency (Days) printers Lead Time (Days) Frequency (Orders) 25 15 The first policy that the manager wants to test is an order quantity of 20 printers with a reorder point of 5 printers. Conduct the simulation for a 20 day period? Use excel. The warehouse is open 200 days a year. Estimated ordering cost is SR30 per order. Holding cost is SR 22 per drill per year. Lost sales cost SR 25. Find total daily cost. Re-simulate using different values of an order quantity of (35 printers) and reorder point of (4 printers). Compare costs of the two policies. Based on the obtained cost which policy you would recommend
Step by Step Solution
There are 3 Steps involved in it
1 Expert Approved Answer
Step: 1 Unlock

Question Has Been Solved by an Expert!
Get step-by-step solutions from verified subject matter experts
Step: 2 Unlock
Step: 3 Unlock