Looking at the summarized financial overview and trend analysis for Starbucks, provide an overall assessment of the company and recommendations for the company along the following lines
1. Revenue
2. Net Earnings
3. Expenditure
4. Asset distribution
5. Capital Structure
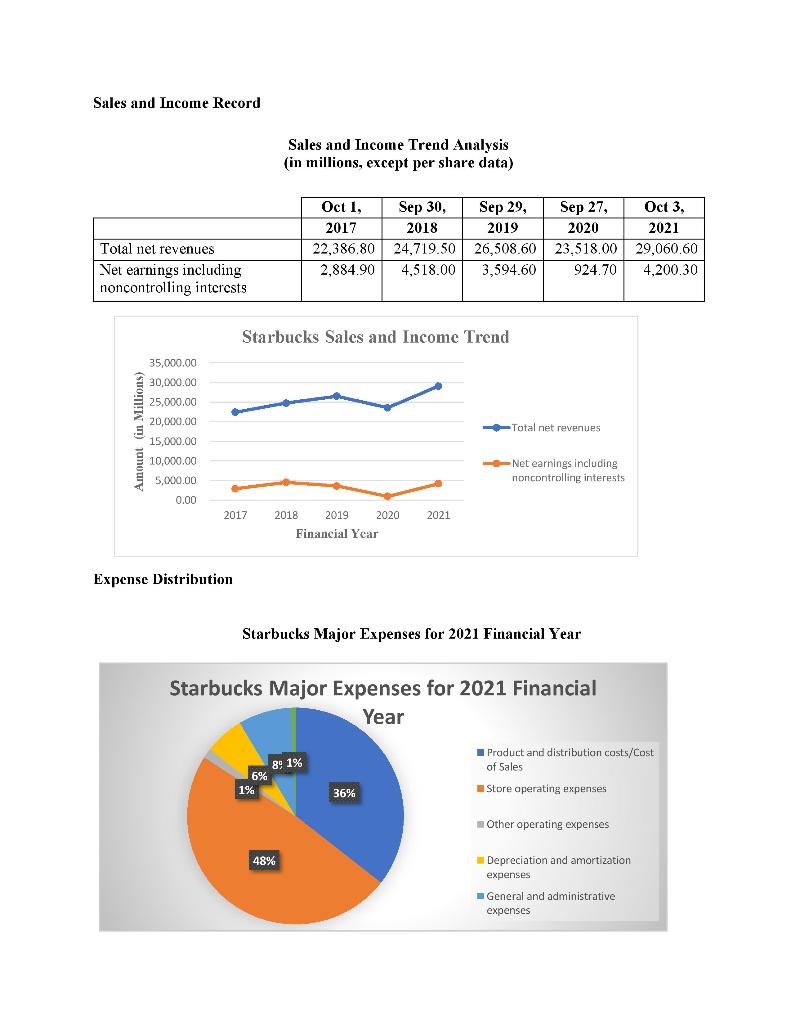
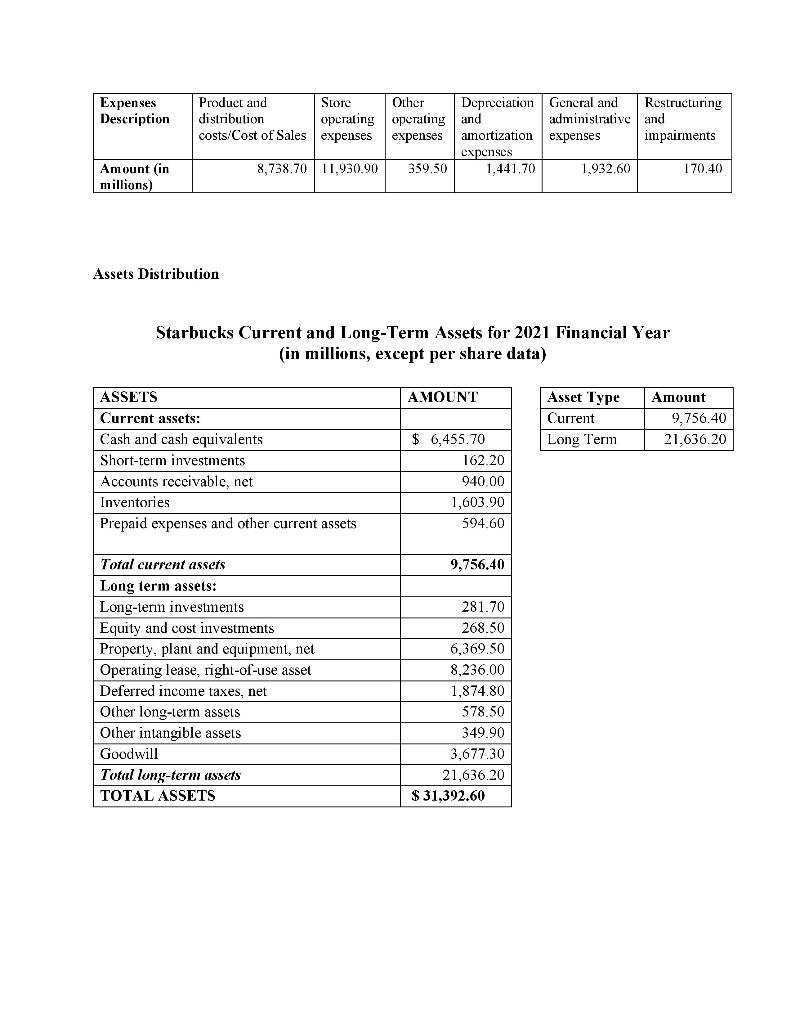
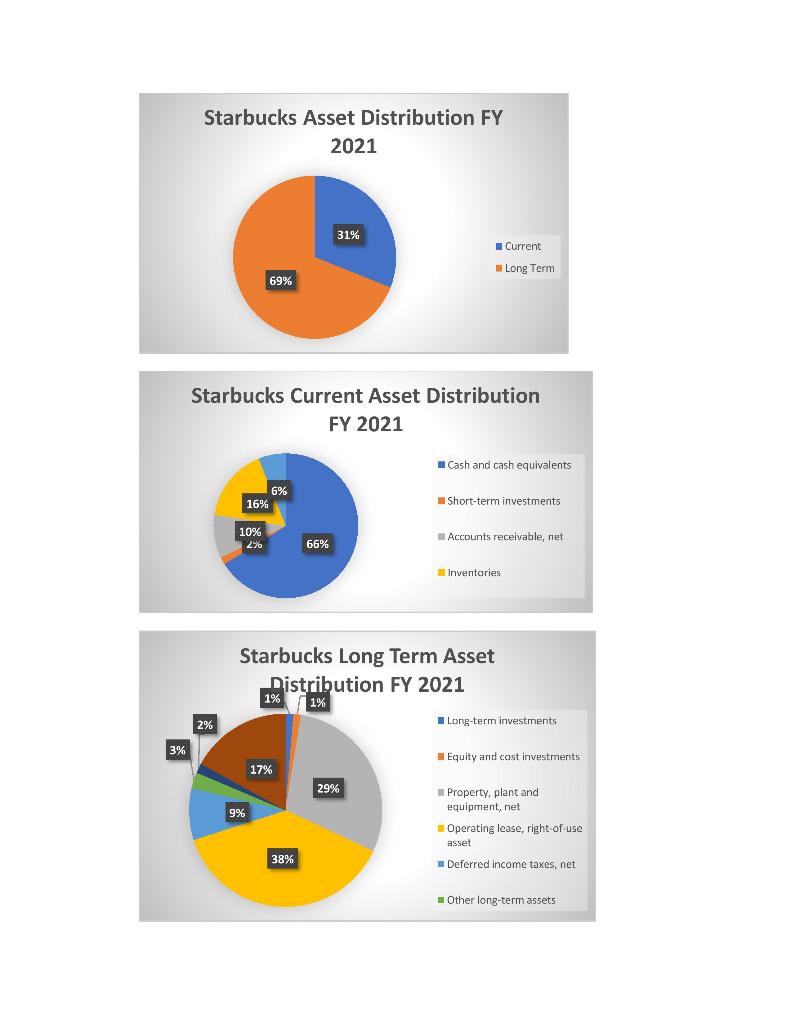
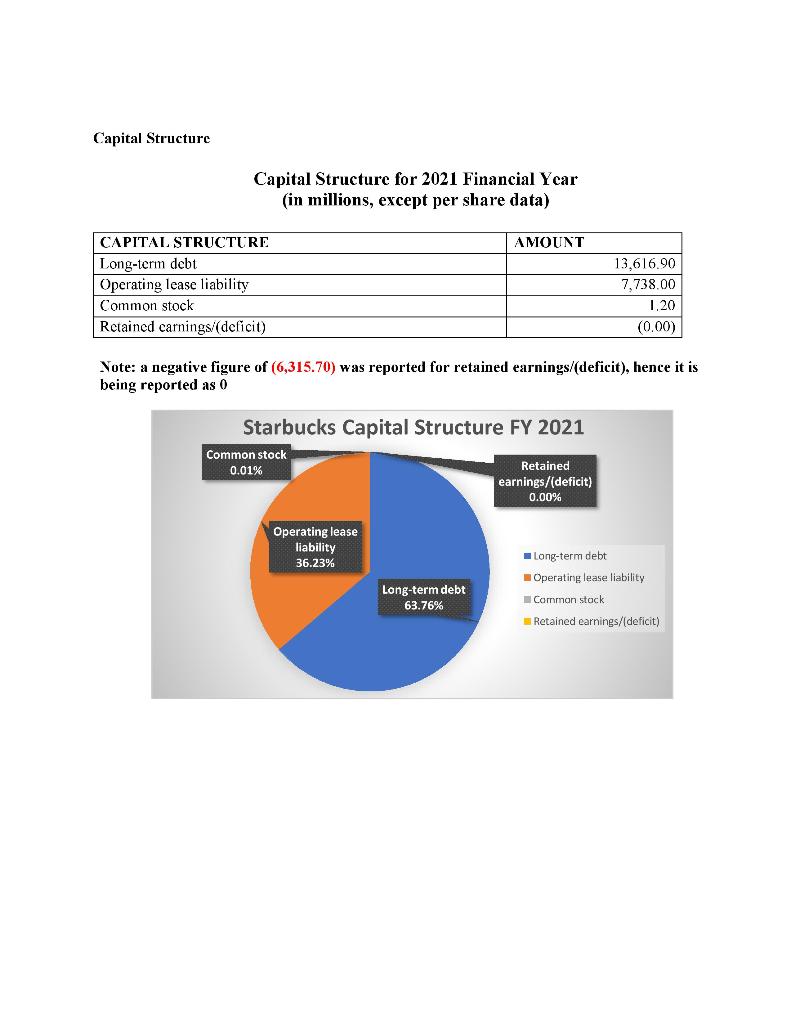

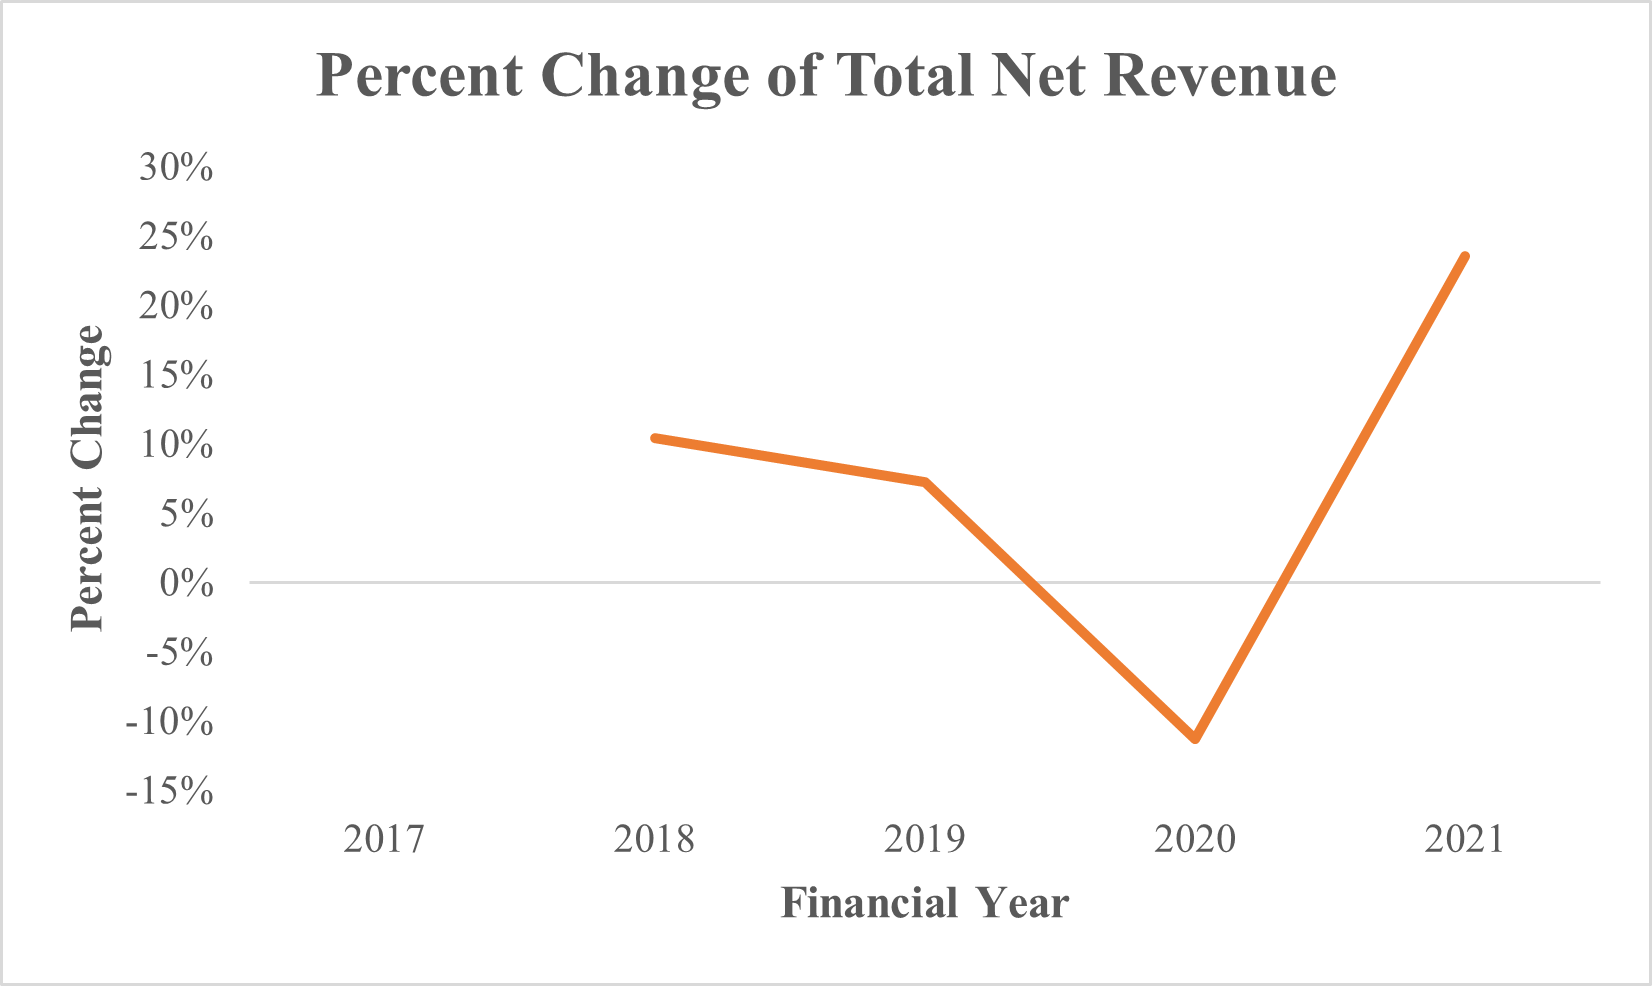

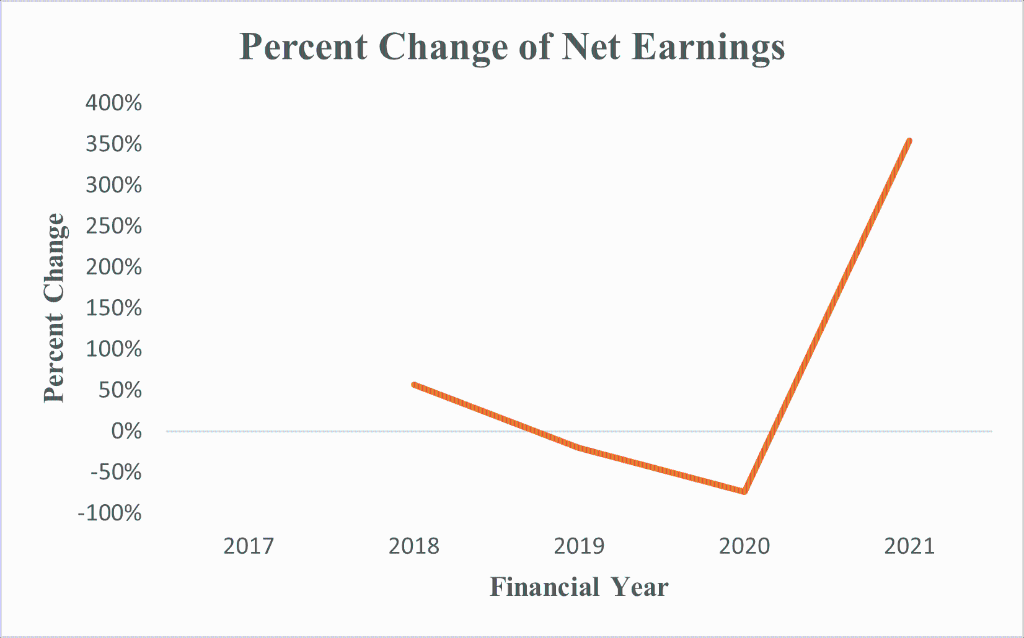
Sales and Income Record Sales and Income Trend Analysis (in millions, except per share data) Sep 29, Oct 1, Sep 30, Sep 27, Oct 3. 2017 2018 2019 2020 2021 22,386.80 24,719.50 26,508.60 23,518,00 29,060.60 2.884.90 4,518.00 3,594.60 924.70 4,200.30 Total net revenues Net earnings including noncontrolling interests Starbucks Sales and Income Trend 35,000.00 30,000.00 25,000.00 20,000.00 Amount (in Millions) Total net revenues 15,000.00 10,000.00 5,000.00 Net earnings including noncontrolling interests 0.00 2017 2021 2018 2019 2020 Financial Year Expense Distribution Starbucks Major Expenses for 2021 Financial Year Starbucks Major Expenses for 2021 Financial Year Product and distribution costs/Cost of Sales 89 1% 6% 1% 36% Store operating expenses Other operating expenses 48% Depreciation and amortization expenses General and administrative expenses Expenses Description Product and Store Other Depreciation General and Restructuring distribution operating operating and administrative and costs/Cost of Sales expenses expenses amortization expenses impairments expenses 8,738,70 11,930.90 359.50 1,441.70 1.932.60 170,40 Amount (in millions) Assets Distribution Starbucks Current and Long-Term Assets for 2021 Financial Year (in millions, except per share data) AMOUNT Asset Type Current Long Term Amount 9,756.40 21.636.20 ASSETS Current assets: Cash and cash equivalents Short-term investments Accounts receivable, net Inventories Prepaid expenses and other current assets $ 6,455.70 162.20 940.00 1,603.90 594.60 9,756.40 Total current assets Long term assets: Long-terin investments Equity and cost investments Property, plant and equipment, net Operating lease, right-of-use asset Deferred income taxes, net Other long-term assets Other intangible assets Goodwill Total long-term assets TOTAL ASSETS 281.70 268.50 6,369.50 8,236.00 1,874.80 578.50 349.90 3,677.30 21,636.20 $ 31,392.60 Starbucks Asset Distribution FY 2021 31% Current Long Term 69% Starbucks Current Asset Distribution FY 2021 Cash and cash equivalents 6% 16% Short-term investments 10% 2% Accounts receivable, net 66% Inventaries Starbucks Long Term Asset Distribution FY 2021 1% 1% 2% Long-term investments 3% Equity and cast investments 17% 29% 9% Property, plant and equipment, net Operating lease, right of use asset 38% Deferred income taxes, net Other long-term assets Capital Structure Capital Structure for 2021 Financial Year (in millions, except per share data) AMOUNT CAPITAL STRUCTURE Long-term debt Operating lease liability Common stock Retained carnings/(deficit) 13,616.90 7,738.00 1.20 (0.00) Note: a negative figure of (6,315.70) was reported for retained earnings/(deficit), hence it is being reported as 0 Starbucks Capital Structure FY 2021 Common stock 0.01% Retained earnings/(deficit) 0.00% Operating lease liability 36.23% Long-term debt 63.76% long-term debt Operating lease liability Common stock Retained earnings/(deficit) Sales and Income Trend Analysis (in milions) Total net reveries Percent Change of Total Net Revenue Oct 1, Sep 30, Sep 29, Sep 27, Oct 3, 2017 2018 2019 2020 2021 22,386.80 24.719.50 26,508.60 23,518.00 29,060.60 10.42% 7.24% -11.28% 23.57% 0.1042 0.0724 (0.1128) 0.2357 6.74% 1.1042 1.0724 0.8872 1.2357 Geometric Mean Change over 4 years Percent Change of Total Net Revenue 30% 25% 20% 15% 10% Percent Change 5% 0% -5% -10% -15% 2017 2018 2019 2020 2021 Financial Year Sep 29. Oct 1, 2017 2,884.90 Sep 30, 2018 4,518.00 2019 Sep 27, Oct 3, 2020 2021 924.70 4.200.30 3,594.60 Net earnings including noncontrolling interests Percent Change of net earnings 56.61% 0.5661 -20.44% -0.2044 -74.28% 354.23% -0.7428 3.542338 0.2572 4.542338 Geometric Mean Change over 4 years 9.84% 1.5661 0.7956 Percent Change of Net Earnings 400% 350% 300% 250% 200% Percent Change 150% 100% 50% 0% -50% -100% 2017 2018 2019 2020 2021 Financial Year Sales and Income Record Sales and Income Trend Analysis (in millions, except per share data) Sep 29, Oct 1, Sep 30, Sep 27, Oct 3. 2017 2018 2019 2020 2021 22,386.80 24,719.50 26,508.60 23,518,00 29,060.60 2.884.90 4,518.00 3,594.60 924.70 4,200.30 Total net revenues Net earnings including noncontrolling interests Starbucks Sales and Income Trend 35,000.00 30,000.00 25,000.00 20,000.00 Amount (in Millions) Total net revenues 15,000.00 10,000.00 5,000.00 Net earnings including noncontrolling interests 0.00 2017 2021 2018 2019 2020 Financial Year Expense Distribution Starbucks Major Expenses for 2021 Financial Year Starbucks Major Expenses for 2021 Financial Year Product and distribution costs/Cost of Sales 89 1% 6% 1% 36% Store operating expenses Other operating expenses 48% Depreciation and amortization expenses General and administrative expenses Expenses Description Product and Store Other Depreciation General and Restructuring distribution operating operating and administrative and costs/Cost of Sales expenses expenses amortization expenses impairments expenses 8,738,70 11,930.90 359.50 1,441.70 1.932.60 170,40 Amount (in millions) Assets Distribution Starbucks Current and Long-Term Assets for 2021 Financial Year (in millions, except per share data) AMOUNT Asset Type Current Long Term Amount 9,756.40 21.636.20 ASSETS Current assets: Cash and cash equivalents Short-term investments Accounts receivable, net Inventories Prepaid expenses and other current assets $ 6,455.70 162.20 940.00 1,603.90 594.60 9,756.40 Total current assets Long term assets: Long-terin investments Equity and cost investments Property, plant and equipment, net Operating lease, right-of-use asset Deferred income taxes, net Other long-term assets Other intangible assets Goodwill Total long-term assets TOTAL ASSETS 281.70 268.50 6,369.50 8,236.00 1,874.80 578.50 349.90 3,677.30 21,636.20 $ 31,392.60 Starbucks Asset Distribution FY 2021 31% Current Long Term 69% Starbucks Current Asset Distribution FY 2021 Cash and cash equivalents 6% 16% Short-term investments 10% 2% Accounts receivable, net 66% Inventaries Starbucks Long Term Asset Distribution FY 2021 1% 1% 2% Long-term investments 3% Equity and cast investments 17% 29% 9% Property, plant and equipment, net Operating lease, right of use asset 38% Deferred income taxes, net Other long-term assets Capital Structure Capital Structure for 2021 Financial Year (in millions, except per share data) AMOUNT CAPITAL STRUCTURE Long-term debt Operating lease liability Common stock Retained carnings/(deficit) 13,616.90 7,738.00 1.20 (0.00) Note: a negative figure of (6,315.70) was reported for retained earnings/(deficit), hence it is being reported as 0 Starbucks Capital Structure FY 2021 Common stock 0.01% Retained earnings/(deficit) 0.00% Operating lease liability 36.23% Long-term debt 63.76% long-term debt Operating lease liability Common stock Retained earnings/(deficit) Sales and Income Trend Analysis (in milions) Total net reveries Percent Change of Total Net Revenue Oct 1, Sep 30, Sep 29, Sep 27, Oct 3, 2017 2018 2019 2020 2021 22,386.80 24.719.50 26,508.60 23,518.00 29,060.60 10.42% 7.24% -11.28% 23.57% 0.1042 0.0724 (0.1128) 0.2357 6.74% 1.1042 1.0724 0.8872 1.2357 Geometric Mean Change over 4 years Percent Change of Total Net Revenue 30% 25% 20% 15% 10% Percent Change 5% 0% -5% -10% -15% 2017 2018 2019 2020 2021 Financial Year Sep 29. Oct 1, 2017 2,884.90 Sep 30, 2018 4,518.00 2019 Sep 27, Oct 3, 2020 2021 924.70 4.200.30 3,594.60 Net earnings including noncontrolling interests Percent Change of net earnings 56.61% 0.5661 -20.44% -0.2044 -74.28% 354.23% -0.7428 3.542338 0.2572 4.542338 Geometric Mean Change over 4 years 9.84% 1.5661 0.7956 Percent Change of Net Earnings 400% 350% 300% 250% 200% Percent Change 150% 100% 50% 0% -50% -100% 2017 2018 2019 2020 2021 Financial Year


