

Answered step by step
Verified Expert Solution
Question
1 Approved Answer
Madhu Patel is a sales analyst for Four Winds Energy, a manufacturer of wind energy products, in San Antonio, Texas. Madhu is developing a workbook

- Madhu Patel is a sales analyst for Four Winds Energy, a manufacturer of wind energy products, in San Antonio, Texas. Madhu is developing a workbook to analyze the profitability of the company's wind turbines. She asks you to help her analyze the sales data to determine how the company can increase profits. Go to the Income Analysis worksheet, which lists the revenue and expenses for the Boreas wind turbine and calculates the net income. Madhu wants to compare the financial outcomes for varying amounts of turbines sold and identify the number of units the company needs to sell to break even. Madhu has already entered formulas in the range E5:H5 to extract data from the income analysis in the range B4:C26. In the range E5:H14, create a one-variable data table using cell C5 as the Column input cell, to calculate the revenue, expenses, and net income based on units sold.
please help question 1 to 11
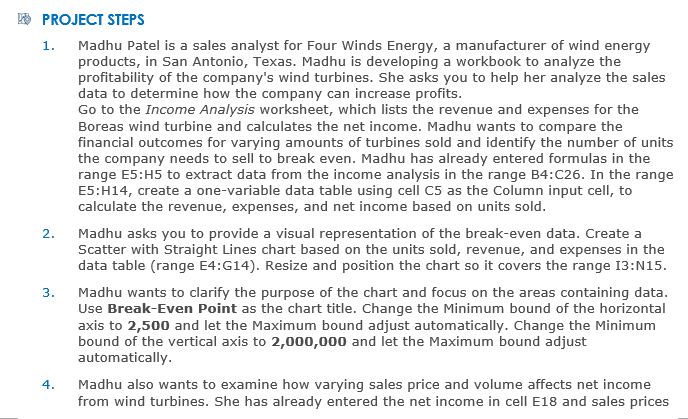
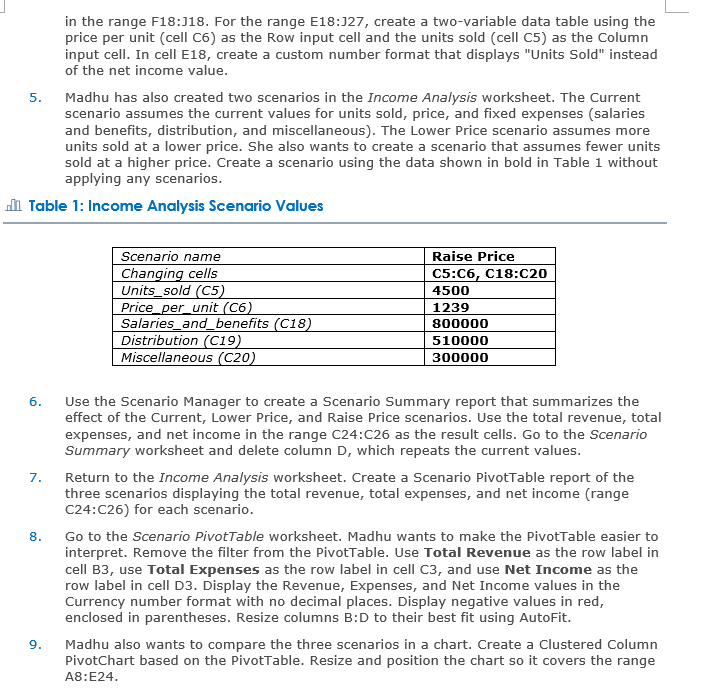
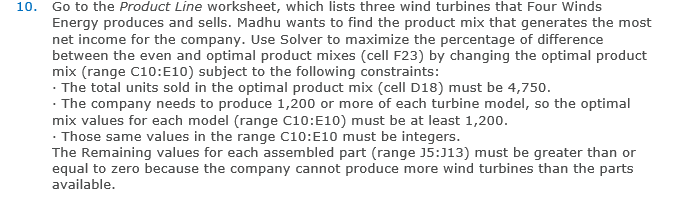
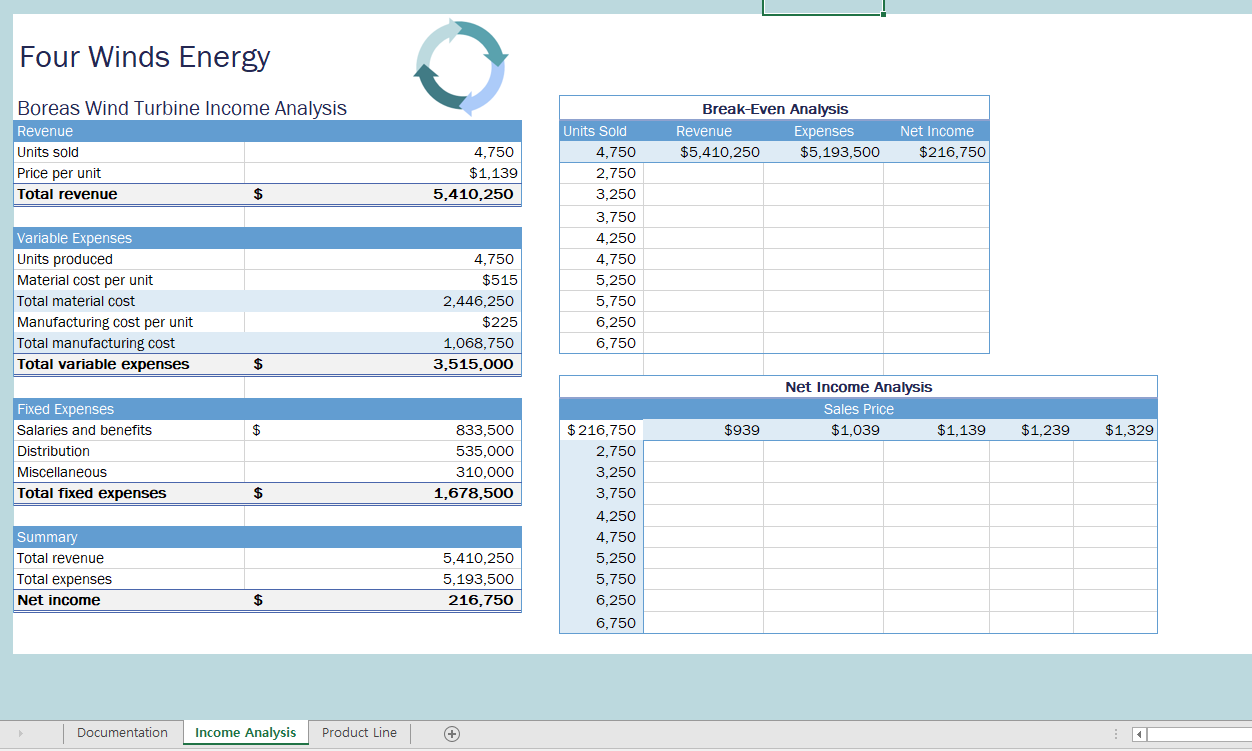
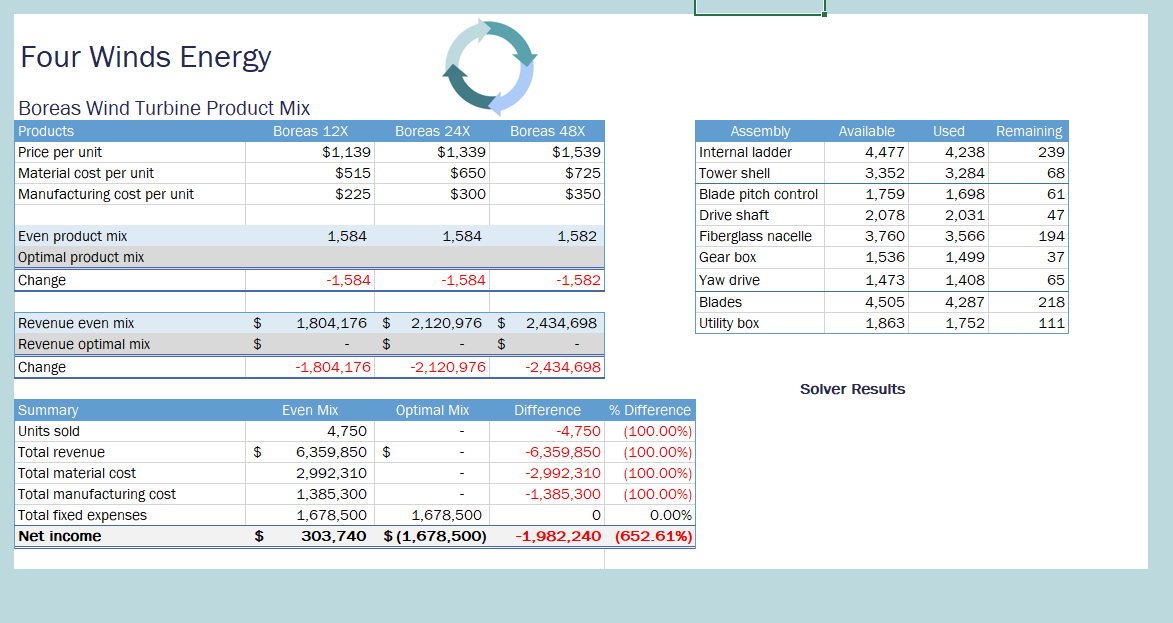
PROJECT STEPS 1. Madhu Patel is a sales analyst for Four Winds Energy, a manufacturer of wind energy products, in San Antonio, Texas. Madhu is developing a workbook to analyze the profitability of the company's wind turbines. She asks you to help her analyze the sales data to determine how the company can increase profits. Go to the Income Analysis worksheet, which lists the revenue and expenses for the Boreas wind turbine and calculates the net income. Madhu wants to compare the financial outcomes for varying amounts of turbines sold and identify the number of units the company needs to sell to break even. Madhu has already entered formulas in the range E5:H5 to extract data from the income analysis in the range B4:C26. In the range E5:H14, create a one-variable data table using cell C5 as the Column input cell, to calculate the revenue, expenses, and net income based on units sold. Madhu asks you to provide a visual representation of the break-even data. Create a Scatter with Straight Lines chart based on the units sold, revenue, and expenses in the data table (range E4:G14). Resize and position the chart so it covers the range 13:N15. Madhu wants to clarify the purpose of the chart and focus on the areas containing data. Use Break-Even Point as the chart title. Change the Minimum bound of the horizontal axis to 2,500 and let the Maximum bound adjust automatically. Change the Minimum bound of the vertical axis to 2,000,000 and let the Maximum bound adjust automatically. Madhu also wants to examine how varying sales price and volume affects net income from wind turbines. She has already entered the net income in cell E18 and sales prices 2. 3. 4. 5. in the range F18:118. For the range E18:127, create a two-variable data table using the price per unit (cell C6) as the Row input cell and the units sold (cell C5) as the Column input cell. In cell E18, create a custom number format that displays "Units Sold" instead of the net income value. Madhu has also created two scenarios in the Income Analysis worksheet. The Current scenario assumes the current values for units sold, price, and fixed expenses (salaries and benefits, distribution, and miscellaneous). The Lower Price scenario assumes more units sold at a lower price. She also wants to create a scenario that assumes fewer units sold at a higher price. Create a scenario using the data shown in bold in Table 1 without applying any scenarios. II Table 1: Income Analysis Scenario Values Scenario name Changing cells Units_sold (C5) Price_per_unit (C6) Salaries_and_benefits (C18) Distribution C19) Miscellaneous (C20) Raise Price C5:C6, C18:C20 4500 1239 800000 510000 300000 6. 7. 8. Use the Scenario Manager to create a Scenario Summary report that summarizes the effect of the Current, Lower Price, and Raise Price scenarios. Use the total revenue, total expenses, and net income in the range C24:C26 as the result cells. Go to the Scenario Summary worksheet and delete column D, which repeats the current values. Return to the Income Analysis worksheet. Create a Scenario PivotTable report of the three scenarios displaying the total revenue, total expenses, and net income (range C24:C26) for each scenario. Go to the Scenario PivotTable worksheet. Madhu wants to make the Pivottable easier to interpret. Remove the filter from the Pivottable. Use Total Revenue as the row label in cell B3, use Total Expenses as the row label in cell C3, and use Net Income as the row label in cell D3. Display the Revenue, Expenses, and Net Income values in the Currency number format with no decimal places. Display negative values in red, enclosed in parentheses. Resize columns B:D to their best fit using AutoFit. Madhu also wants to compare the three scenarios in a chart. Create a Clustered Column PivotChart based on the PivotTable. Resize and position the chart so it covers the range A8:E24. 9. 10. Go to the Product Line worksheet, which lists three wind turbines that Four Winds Energy produces and sells. Madhu wants to find the product mix that generates the most net income for the company. Use Solver to maximize the percentage of difference between the even and optimal product mixes (cell F23) by changing the optimal product mix (range C10:E10) subject to the following constraints: . The total units sold in the optimal product mix (cell D18) must be 4,750. . The company needs to produce 1,200 or more of each turbine model, so the optimal mix values for each model (range c10:E10) must be at least 1,200. Those same values in the range c10:E10 must be integers. The Remaining values for each assembled part (range 15:113) must be greater than or equal to zero because the company cannot produce more wind turbines than the parts available. 11. Run Solver, keep the solution, and then return to the Solver Parameters dialog box. Save the model to the range H17:H24, and then close the Solver Parameters dialog box. Your workbook should look like the Final Figures on the following pages. Save your changes, close the workbook, and then exit Excel. Follow the directions on the SAM website to submit your completed project. Four Winds Energy Boreas Wind Turbine Income Analysis Revenue Units sold Price per unit Total revenue $ Break-Even Analysis Revenue Expenses $5,410,250 $5,193,500 Net Income $216,750 4,750 $1,139 5,410,250 Variable Expenses Units produced Material cost per unit Total material cost Manufacturing cost per unit Total manufacturing cost Total variable expenses Units Sold 4,750 2,750 3,250 3,750 4,250 4,750 5.250 5,750 6,250 6.750 4,750 $515 2,446,250 $225 1,068,750 3,515,000 $ Net Income Analysis Sales Price $1,039 $1,139 $ $939 $1,239 $1,329 Fixed Expenses Salaries and benefits Distribution Miscellaneous Total fixed expenses 833,500 535,000 310,000 1,678,500 $ $216,750 2,750 3,250 3,750 4.250 4.750 5,250 5,750 6,250 6,750 Summary Total revenue Total expenses Net income 5,410,250 5,193,500 216,750 $ Documentation Income Analysis Product Line Four Winds Energy Boreas Wind Turbine Product Mix Products Boreas 12x Price per unit $1,139 Material cost per unit $515 Manufacturing cost per unit $225 Boreas 24X $1,339 $650 $300 Boreas 48X $1,539 $725 $350 Assembly Internal ladder Tower shell Blade pitch control Drive shaft Fiberglass nacelle Gear box Yaw drive Blades Utility box Available 4,477 3,352 1,759 2,078 3,760 Used 4.238 3,284 1,698 2,031 3,566 1,499 1,408 4,287 1.752 Remaining 239 68 61 47 194 37 1,584 1,584 1,582 Even product mix Optimal product mix Change 1,536 -1,584 -1,584 -1,582 1,473 4,505 1,863 65 218 111 2,434,698 Revenue even mix Revenue optimal mix Change $ $ 1,804,176 $ $ -1,804,176 2,120,976 $ $ -2,120,976 -2,434,698 Solver Results $ Summary Units sold Total revenue Total material cost Total manufacturing cost Total fixed expenses Net income Even Mix Optimal Mix 4,750 6,359,850 $ 2,992,310 1,385,300 1,678,500 1,678,500 303,740 $ (1,678,500) Difference % Difference -4,750 (100.00%) -6,359,850 (100.00%) -2,992,310 (100.00%) -1,385,300 (100.00%) O 0.00% -1,982,240 (652.61%) $ PROJECT STEPS 1. Madhu Patel is a sales analyst for Four Winds Energy, a manufacturer of wind energy products, in San Antonio, Texas. Madhu is developing a workbook to analyze the profitability of the company's wind turbines. She asks you to help her analyze the sales data to determine how the company can increase profits. Go to the Income Analysis worksheet, which lists the revenue and expenses for the Boreas wind turbine and calculates the net income. Madhu wants to compare the financial outcomes for varying amounts of turbines sold and identify the number of units the company needs to sell to break even. Madhu has already entered formulas in the range E5:H5 to extract data from the income analysis in the range B4:C26. In the range E5:H14, create a one-variable data table using cell C5 as the Column input cell, to calculate the revenue, expenses, and net income based on units sold. Madhu asks you to provide a visual representation of the break-even data. Create a Scatter with Straight Lines chart based on the units sold, revenue, and expenses in the data table (range E4:G14). Resize and position the chart so it covers the range 13:N15. Madhu wants to clarify the purpose of the chart and focus on the areas containing data. Use Break-Even Point as the chart title. Change the Minimum bound of the horizontal axis to 2,500 and let the Maximum bound adjust automatically. Change the Minimum bound of the vertical axis to 2,000,000 and let the Maximum bound adjust automatically. Madhu also wants to examine how varying sales price and volume affects net income from wind turbines. She has already entered the net income in cell E18 and sales prices 2. 3. 4. 5. in the range F18:118. For the range E18:127, create a two-variable data table using the price per unit (cell C6) as the Row input cell and the units sold (cell C5) as the Column input cell. In cell E18, create a custom number format that displays "Units Sold" instead of the net income value. Madhu has also created two scenarios in the Income Analysis worksheet. The Current scenario assumes the current values for units sold, price, and fixed expenses (salaries and benefits, distribution, and miscellaneous). The Lower Price scenario assumes more units sold at a lower price. She also wants to create a scenario that assumes fewer units sold at a higher price. Create a scenario using the data shown in bold in Table 1 without applying any scenarios. II Table 1: Income Analysis Scenario Values Scenario name Changing cells Units_sold (C5) Price_per_unit (C6) Salaries_and_benefits (C18) Distribution C19) Miscellaneous (C20) Raise Price C5:C6, C18:C20 4500 1239 800000 510000 300000 6. 7. 8. Use the Scenario Manager to create a Scenario Summary report that summarizes the effect of the Current, Lower Price, and Raise Price scenarios. Use the total revenue, total expenses, and net income in the range C24:C26 as the result cells. Go to the Scenario Summary worksheet and delete column D, which repeats the current values. Return to the Income Analysis worksheet. Create a Scenario PivotTable report of the three scenarios displaying the total revenue, total expenses, and net income (range C24:C26) for each scenario. Go to the Scenario PivotTable worksheet. Madhu wants to make the Pivottable easier to interpret. Remove the filter from the Pivottable. Use Total Revenue as the row label in cell B3, use Total Expenses as the row label in cell C3, and use Net Income as the row label in cell D3. Display the Revenue, Expenses, and Net Income values in the Currency number format with no decimal places. Display negative values in red, enclosed in parentheses. Resize columns B:D to their best fit using AutoFit. Madhu also wants to compare the three scenarios in a chart. Create a Clustered Column PivotChart based on the PivotTable. Resize and position the chart so it covers the range A8:E24. 9. 10. Go to the Product Line worksheet, which lists three wind turbines that Four Winds Energy produces and sells. Madhu wants to find the product mix that generates the most net income for the company. Use Solver to maximize the percentage of difference between the even and optimal product mixes (cell F23) by changing the optimal product mix (range C10:E10) subject to the following constraints: . The total units sold in the optimal product mix (cell D18) must be 4,750. . The company needs to produce 1,200 or more of each turbine model, so the optimal mix values for each model (range c10:E10) must be at least 1,200. Those same values in the range c10:E10 must be integers. The Remaining values for each assembled part (range 15:113) must be greater than or equal to zero because the company cannot produce more wind turbines than the parts available. 11. Run Solver, keep the solution, and then return to the Solver Parameters dialog box. Save the model to the range H17:H24, and then close the Solver Parameters dialog box. Your workbook should look like the Final Figures on the following pages. Save your changes, close the workbook, and then exit Excel. Follow the directions on the SAM website to submit your completed project. Four Winds Energy Boreas Wind Turbine Income Analysis Revenue Units sold Price per unit Total revenue $ Break-Even Analysis Revenue Expenses $5,410,250 $5,193,500 Net Income $216,750 4,750 $1,139 5,410,250 Variable Expenses Units produced Material cost per unit Total material cost Manufacturing cost per unit Total manufacturing cost Total variable expenses Units Sold 4,750 2,750 3,250 3,750 4,250 4,750 5.250 5,750 6,250 6.750 4,750 $515 2,446,250 $225 1,068,750 3,515,000 $ Net Income Analysis Sales Price $1,039 $1,139 $ $939 $1,239 $1,329 Fixed Expenses Salaries and benefits Distribution Miscellaneous Total fixed expenses 833,500 535,000 310,000 1,678,500 $ $216,750 2,750 3,250 3,750 4.250 4.750 5,250 5,750 6,250 6,750 Summary Total revenue Total expenses Net income 5,410,250 5,193,500 216,750 $ Documentation Income Analysis Product Line Four Winds Energy Boreas Wind Turbine Product Mix Products Boreas 12x Price per unit $1,139 Material cost per unit $515 Manufacturing cost per unit $225 Boreas 24X $1,339 $650 $300 Boreas 48X $1,539 $725 $350 Assembly Internal ladder Tower shell Blade pitch control Drive shaft Fiberglass nacelle Gear box Yaw drive Blades Utility box Available 4,477 3,352 1,759 2,078 3,760 Used 4.238 3,284 1,698 2,031 3,566 1,499 1,408 4,287 1.752 Remaining 239 68 61 47 194 37 1,584 1,584 1,582 Even product mix Optimal product mix Change 1,536 -1,584 -1,584 -1,582 1,473 4,505 1,863 65 218 111 2,434,698 Revenue even mix Revenue optimal mix Change $ $ 1,804,176 $ $ -1,804,176 2,120,976 $ $ -2,120,976 -2,434,698 Solver Results $ Summary Units sold Total revenue Total material cost Total manufacturing cost Total fixed expenses Net income Even Mix Optimal Mix 4,750 6,359,850 $ 2,992,310 1,385,300 1,678,500 1,678,500 303,740 $ (1,678,500) Difference % Difference -4,750 (100.00%) -6,359,850 (100.00%) -2,992,310 (100.00%) -1,385,300 (100.00%) O 0.00% -1,982,240 (652.61%) $Step by Step Solution
There are 3 Steps involved in it
Step: 1

Get Instant Access to Expert-Tailored Solutions
See step-by-step solutions with expert insights and AI powered tools for academic success
Step: 2

Step: 3
Ace Your Homework with AI
Get the answers you need in no time with our AI-driven, step-by-step assistance
Get Started
Guide To Finance Theory And Application Portfolio Mathematics
Authors: Professional Risk Managers' International Association (PRMIA)
1st Edition
0071731814