

Question
Make a line chart and fit an m -period moving average to the exchange rate data shown above with m = 2, 3, 4, and
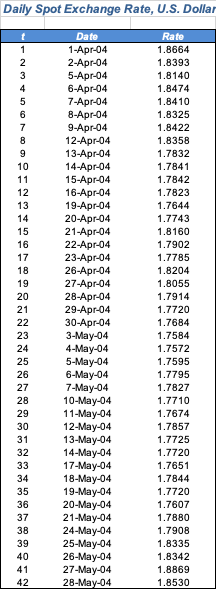
Make a line chart and fit anm-period moving average to the exchange rate data shown above withm= 2, 3, 4, and 5 periods. For each method, state the last MA value.(Round your answers to 4 decimal places.)
m-period. Next period forecast
2___________
3___________
4___________
5___________
Step by Step Solution
There are 3 Steps involved in it
Step: 1

Get Instant Access to Expert-Tailored Solutions
See step-by-step solutions with expert insights and AI powered tools for academic success
Step: 2

Step: 3
Ace Your Homework with AI
Get the answers you need in no time with our AI-driven, step-by-step assistance
Get Started
Mathematics Concepts With Applications
Authors: Charles P McKeague
1st Edition
1630983136, 9781630983130