

Question
Make a sales prediction using the data visualization. A.The company has a concern that the sales department may try to increase the sales revenue in
Make a sales prediction using the data visualization. A.The company has a concern that the sales department may try to increase the sales revenue in December to receive more bonuses. Based on the average quantity sold in each month in 2018 and 2019, do you have the data to confirm whether this is happening? If you do have the data, what data is used to make this confirmation? If you do not have the data, what additional data is needed to make the confirmation?
Analyze product inventory using data visualization. A. Starting in 2020, the company decides to use the change in average quantity sold between December 2018 and December 2019 to predict the inventory level the company needs for each product in 2020. Which products will require a higher inventory level and which products can maintain a similar inventory level?
Explain the advantages of using a data visualization tool for audit analytics.
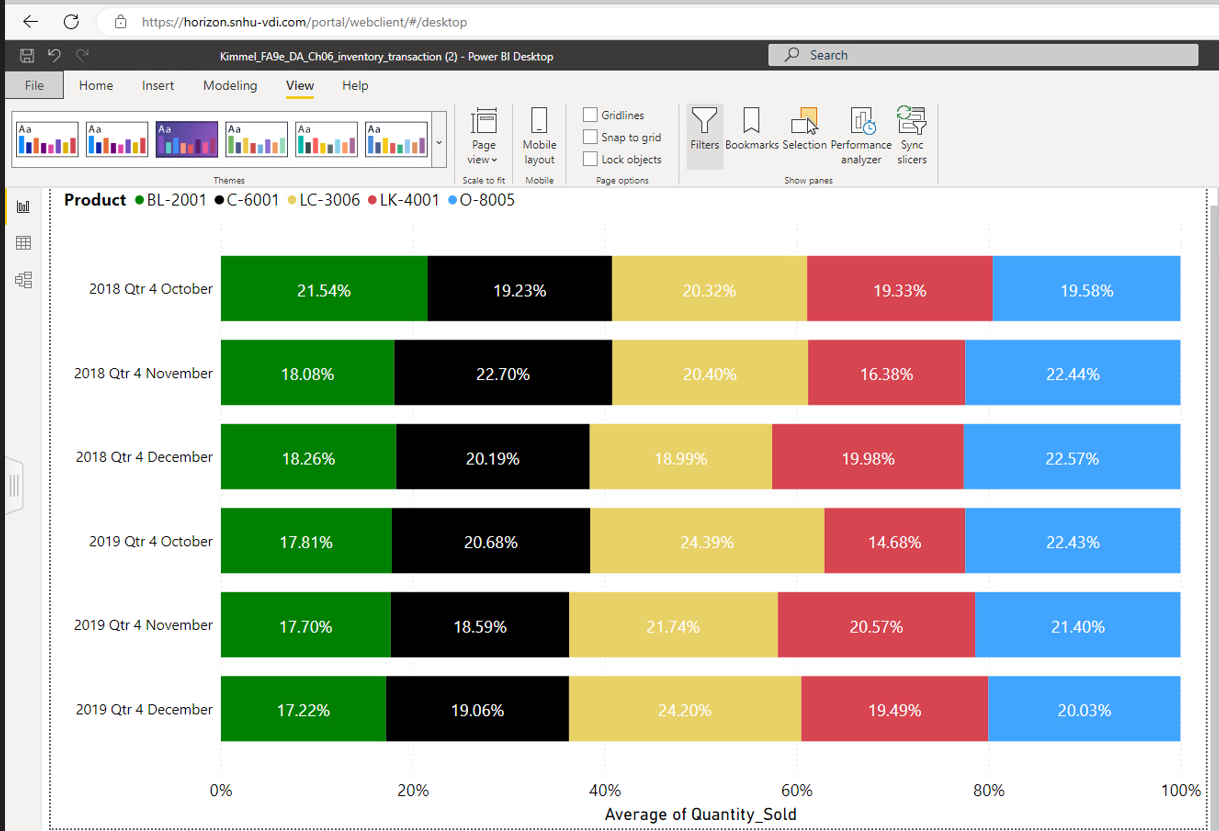 https://horizon.snhu-vdi.com/portal/webclient/\#/desktop Kimmel_FA9e_DA_Ch06_inventory_transaction (2) - Power BI Desktop Search
 Step by Step Solution
There are 3 Steps involved in it
Step: 1

Get Instant Access to Expert-Tailored Solutions
See step-by-step solutions with expert insights and AI powered tools for academic success
Step: 2

Step: 3
Ace Your Homework with AI
Get the answers you need in no time with our AI-driven, step-by-step assistance
Get Started
Accounting Tools for business decision making
Authors: kimmel, weygandt, kieso
4th Edition
978-0470117262, 9780470534786, 470117265, 470534788, 978-0470095461