

Answered step by step
Verified Expert Solution
Question
1 Approved Answer
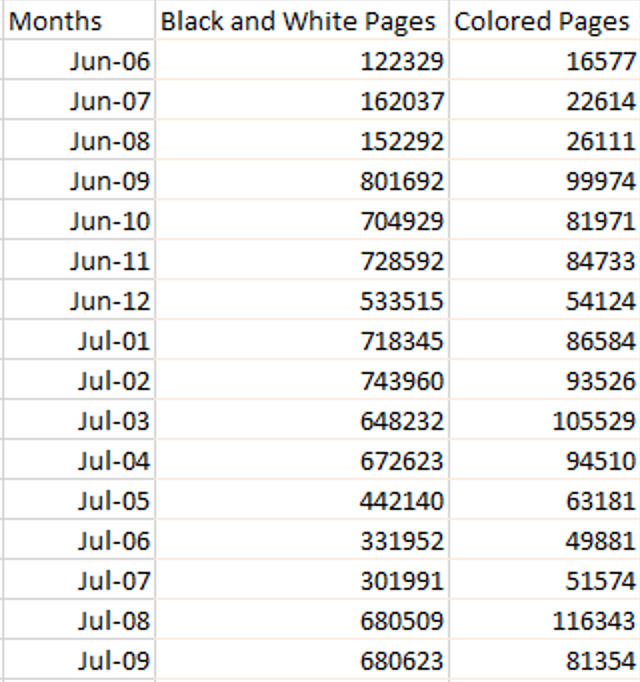
make a time series/line graph that shows the number of B&W pages and the number of color pages printed per month. Add linear trendlines to
- make a time series/line graph that shows the number of B&W pages and the number of color pages printed per month.
- Add linear trendlines to the graph. Paste the graph into the template.
- Forecast the number of pages of each type that will be printed over the next 3 months using:
- Simple trend line
- Holt-Winter model (You may use the Forecast Sheet in Excel 2016 or the Holt-winter forecast is R.)
- Paste the Forecast graph into your solution template
- Comment on which forecast you think would be most accurate and why
Step by Step Solution
There are 3 Steps involved in it
Step: 1

Get Instant Access to Expert-Tailored Solutions
See step-by-step solutions with expert insights and AI powered tools for academic success
Step: 2

Step: 3
Ace Your Homework with AI
Get the answers you need in no time with our AI-driven, step-by-step assistance
Get Started
College Algebra With Applications
Authors: Ernest Julius Wilczynski ,Herbert Ellsworth Slaught
1st Edition
1017336490, 978-1017336498