

Question
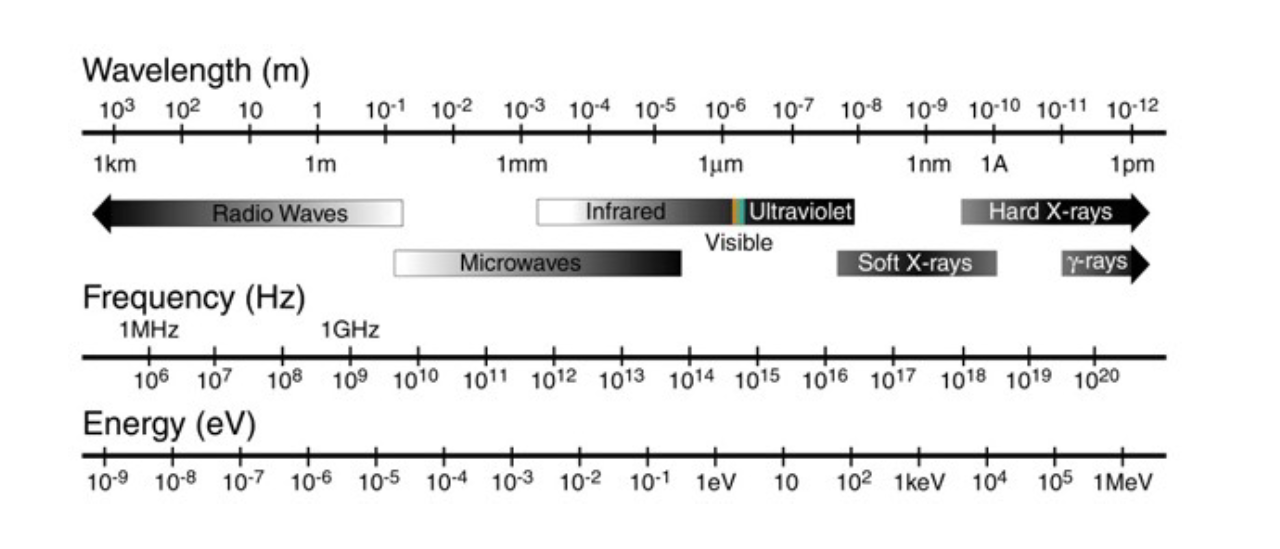
Make plot of the electromagnetic spectrum using Python. Label frequency, wavelength, and eV. Label the various regions of the spectrum Your end product should look
Make plot of the electromagnetic spectrum using Python. Label frequency, wavelength, and eV. Label the various regions of the spectrum
Your end product should look something like this:
I am a beginner in python and I have been spending hours trying to even make the wavelength scales. It is okay if you can help me with only some part of it. Once I get an idea on how and where to start, I can try figuring out the rest. Thank you.
Wavelength (m) 103 102 101 + + + 1km 1m 101 102 + 103 104 105 106 107 108 109 10-10 10-11 10-12 + - - 1mm Tum 1 nm 1A 1pm Radio Waves Infrared Hard X-rays Hard Ultraviolet Visible Soft X-rays Microwaves Y-rays 1 MHz 1GU, Frequency (Hz) 1GHz 106 107 108 109 1010 1011 1012 1013 1014 1015 1016 1017 1018 1019 1020 Energy (EV) 10-9 10-8 107 106 105 104 103 102 101 1eV 10 102 1keV 104 105 1 MeV Wavelength (m) 103 102 101 + + + 1km 1m 101 102 + 103 104 105 106 107 108 109 10-10 10-11 10-12 + - - 1mm Tum 1 nm 1A 1pm Radio Waves Infrared Hard X-rays Hard Ultraviolet Visible Soft X-rays Microwaves Y-rays 1 MHz 1GU, Frequency (Hz) 1GHz 106 107 108 109 1010 1011 1012 1013 1014 1015 1016 1017 1018 1019 1020 Energy (EV) 10-9 10-8 107 106 105 104 103 102 101 1eV 10 102 1keV 104 105 1 MeVStep by Step Solution
There are 3 Steps involved in it
Step: 1

Get Instant Access to Expert-Tailored Solutions
See step-by-step solutions with expert insights and AI powered tools for academic success
Step: 2

Step: 3
Ace Your Homework with AI
Get the answers you need in no time with our AI-driven, step-by-step assistance
Get Started
Climate And Environmental Database Systems
Authors: Michael Lautenschlager ,Manfred Reinke
1st Edition
1461368332, 978-1461368335