Answered step by step
Verified Expert Solution
Link Copied!

Question

1 Approved Answer

Managerial Accounting For Case 4 : Additional data (ignoring taxes): 1. Sales revenue for the year was $2,160,000, COGS was $1,520,000, operating expense was $481,800

Managerial Accounting

For Case 4 :

Additional data (ignoring taxes):

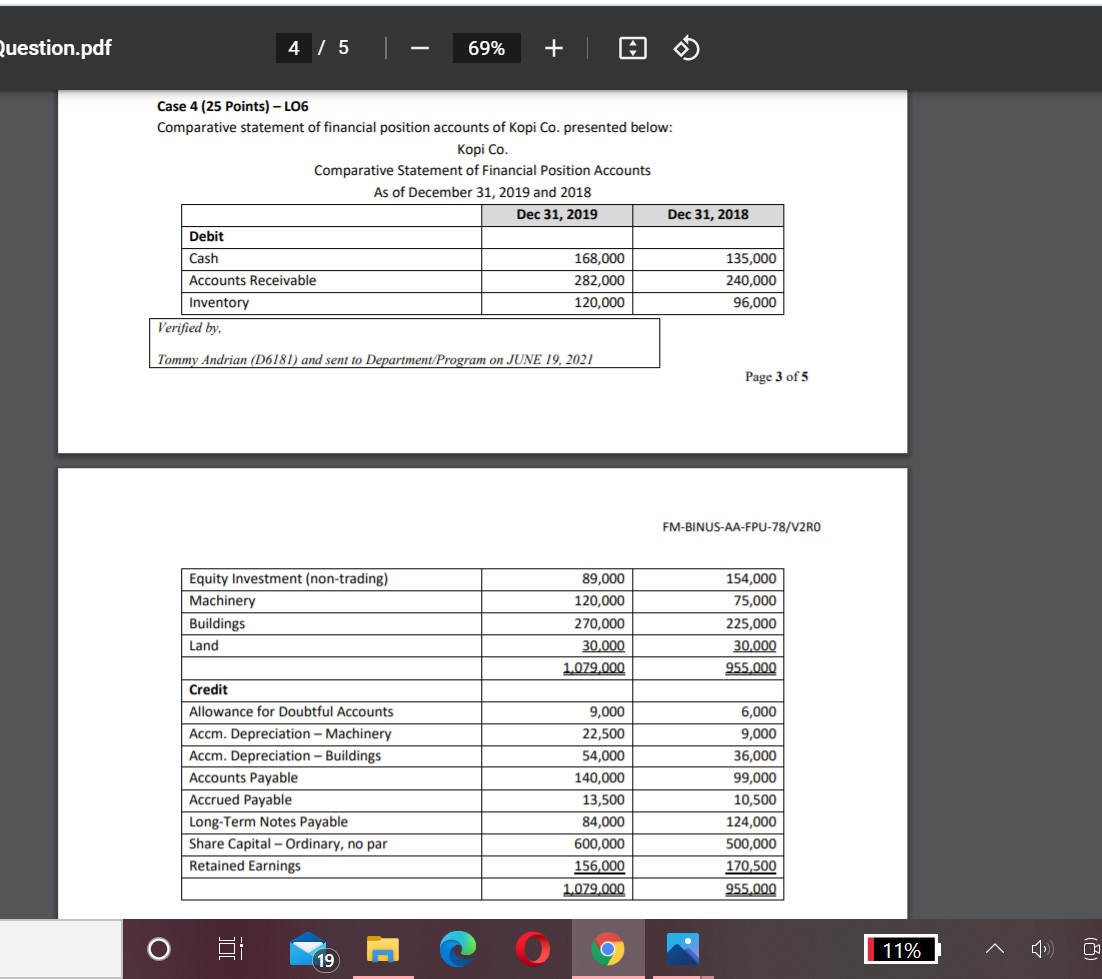
1. Sales revenue for the year was $2,160,000, COGS was $1,520,000, operating expense was $481,800 (includes depreciation and bad debt expense), net income was $170,000.

2. Bad debt expense for the year was $21,600.

3. The cash dividend declared in 2019 was fully paid in 2019.

4. A 20% share dividend was declared during the year.

5. Equity investments that cost $100,000 were sold during the year for $115,000.

6. Machinery that cost $15,000, on which $3,000 of depreciation had accumulated, was sold for $8,800.
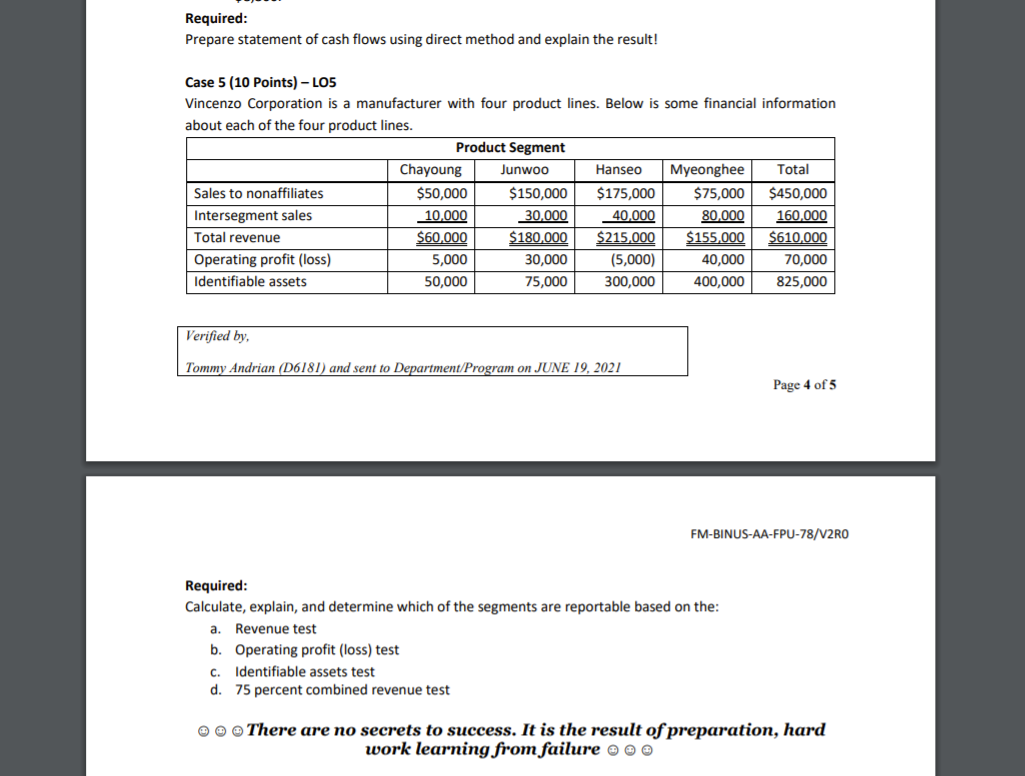
Required:

Prepare statement of cash flows using direct method and explain the result!

image text in transcribedimage text in transcribed
Question.pdf 4 /5 69% + Case 4 (25 Points) - LOG Comparative statement of financial position accounts of Kopi Co. presented below: Kopi Co. Comparative Statement of Financial Position Accounts As of December 31, 2019 and 2018 Dec 31, 2019 Dec 31, 2018 Debit Cash 168,000 135,000 Accounts Receivable 282,000 240,000 Inventory 120,000 96,000 Verified by, Tommy Andrian (D6181) and sent to Department/Program on JUNE 19, 2021 Page 3 of 5 FM-BINUS-AA-FPU-78/V2RO Equity Investment (non-trading) 89,000 154,000 Machinery 120,000 75,000 Buildings 270,000 225,000 Land 30,000 30,000 1,079,000 955,000 Credit Allowance for Doubtful Accounts 9,000 6,000 Accm. Depreciation - Machinery 22,500 9,000 Accm. Depreciation - Buildings 54,000 36,000 Accounts Payable 140,000 99,000 Accrued Payable 13,500 10,500 Long-Term Notes Payable 84,000 124,000 Share Capital - Ordinary, no par 600,000 500,000 Retained Earnings 156,000 170,500 1,079,000 955,000 O 19 @ O 11% ARequired: Prepare statement of cash flows using direct method and explain the result! Case 5 (10 Points) - LOS Vincenzo Corporation is a manufacturer with four product lines. Below is some financial information about each of the four product lines. Product Segment Chayoung Junwoo Hansed Myeonghee Total Sales to nonaffiliates $50,000 $150,000 $175,000 $75,000 $450,000 Intersegment sales 10,000 30.000 40,000 80.000 160,000 Total revenue $60,000 $180,000 $215,000 $155,000 $610,000 Operating profit (loss) 5,000 30,000 (5,000) 40,000 70,000 Identifiable assets 50,000 75,000 300,000 400,000 825,000 Verified by, Tommy Andrian (D6181) and sent to Department/Program on JUNE 19, 2021 Page 4 of 5 FM-BINUS-AA-FPU-78/V2RO Required: Calculate, explain, and determine which of the segments are reportable based on the: a. Revenue test b. Operating profit (loss) test c. Identifiable assets test d. 75 percent combined revenue test There are no secrets to success. It is the result of preparation, hard work learning from failure

Step by Step Solution

There are 3 Steps involved in it

Step: 1

blur-text-image

Get Instant Access to Expert-Tailored Solutions

See step-by-step solutions with expert insights and AI powered tools for academic success

Step: 2

blur-text-image

Step: 3

blur-text-image

Ace Your Homework with AI

Get the answers you need in no time with our AI-driven, step-by-step assistance

Get Started

Recommended Textbook for

Intermediate Accounting

Authors: James D. Stice, Earl K. Stice, Fred Skousen

16th Edition

324376375, 0324375743I, 978-0324376371, 9780324375749, 978-0324312140

More Books

Students also viewed these Accounting questions