Answered step by step
Verified Expert Solution
Link Copied!

Question

1 Approved Answer

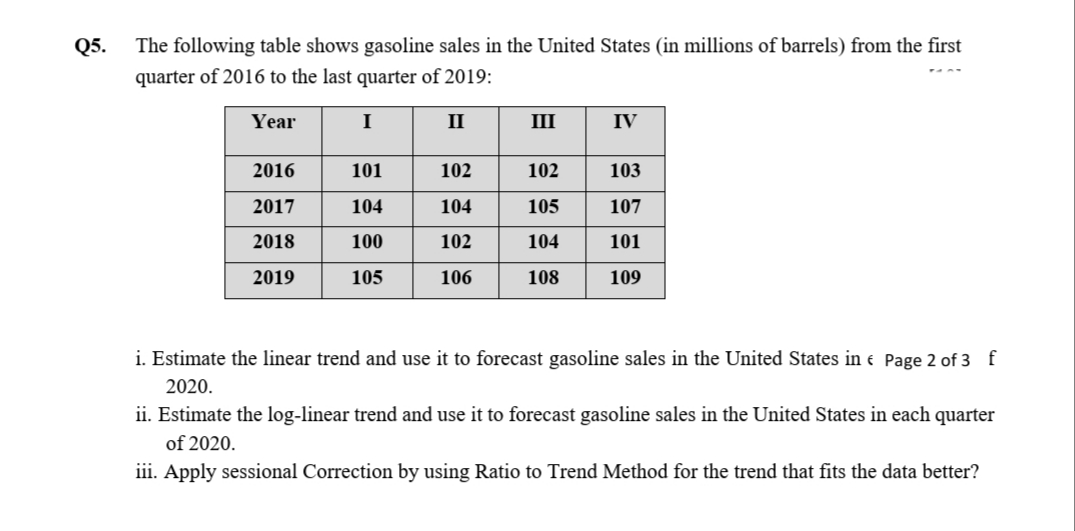
managerial Economics Q5. The following table shows gasoline sales in the United States (in millions of barrels) from the first quarter of 2016 to the

managerial Economics

image text in transcribed
Q5. The following table shows gasoline sales in the United States (in millions of barrels) from the first quarter of 2016 to the last quarter of 2019: Year I II III IV 2016 101 102 102 103 2017 104 104 105 107 2018 100 102 104 101 2019 105 106 108 109 i. Estimate the linear trend and use it to forecast gasoline sales in the United States in c Page 2 of 3 f 2020. ii. Estimate the log-linear trend and use it to forecast gasoline sales in the United States in each quarter of 2020. iii. Apply sessional Correction by using Ratio to Trend Method for the trend that fits the data better

Step by Step Solution

There are 3 Steps involved in it

Step: 1

blur-text-image

Get Instant Access to Expert-Tailored Solutions

See step-by-step solutions with expert insights and AI powered tools for academic success

Step: 2

blur-text-image

Step: 3

blur-text-image

Ace Your Homework with AI

Get the answers you need in no time with our AI-driven, step-by-step assistance

Get Started

Recommended Textbook for

Principles of economics

Authors: N. Gregory Mankiw

6th Edition

978-0538453059, 9781435462120, 538453052, 1435462122, 978-0538453042

More Books

Students also viewed these Economics questions

Question

Explain what workforce diversity represents.

Answered: 1 week ago