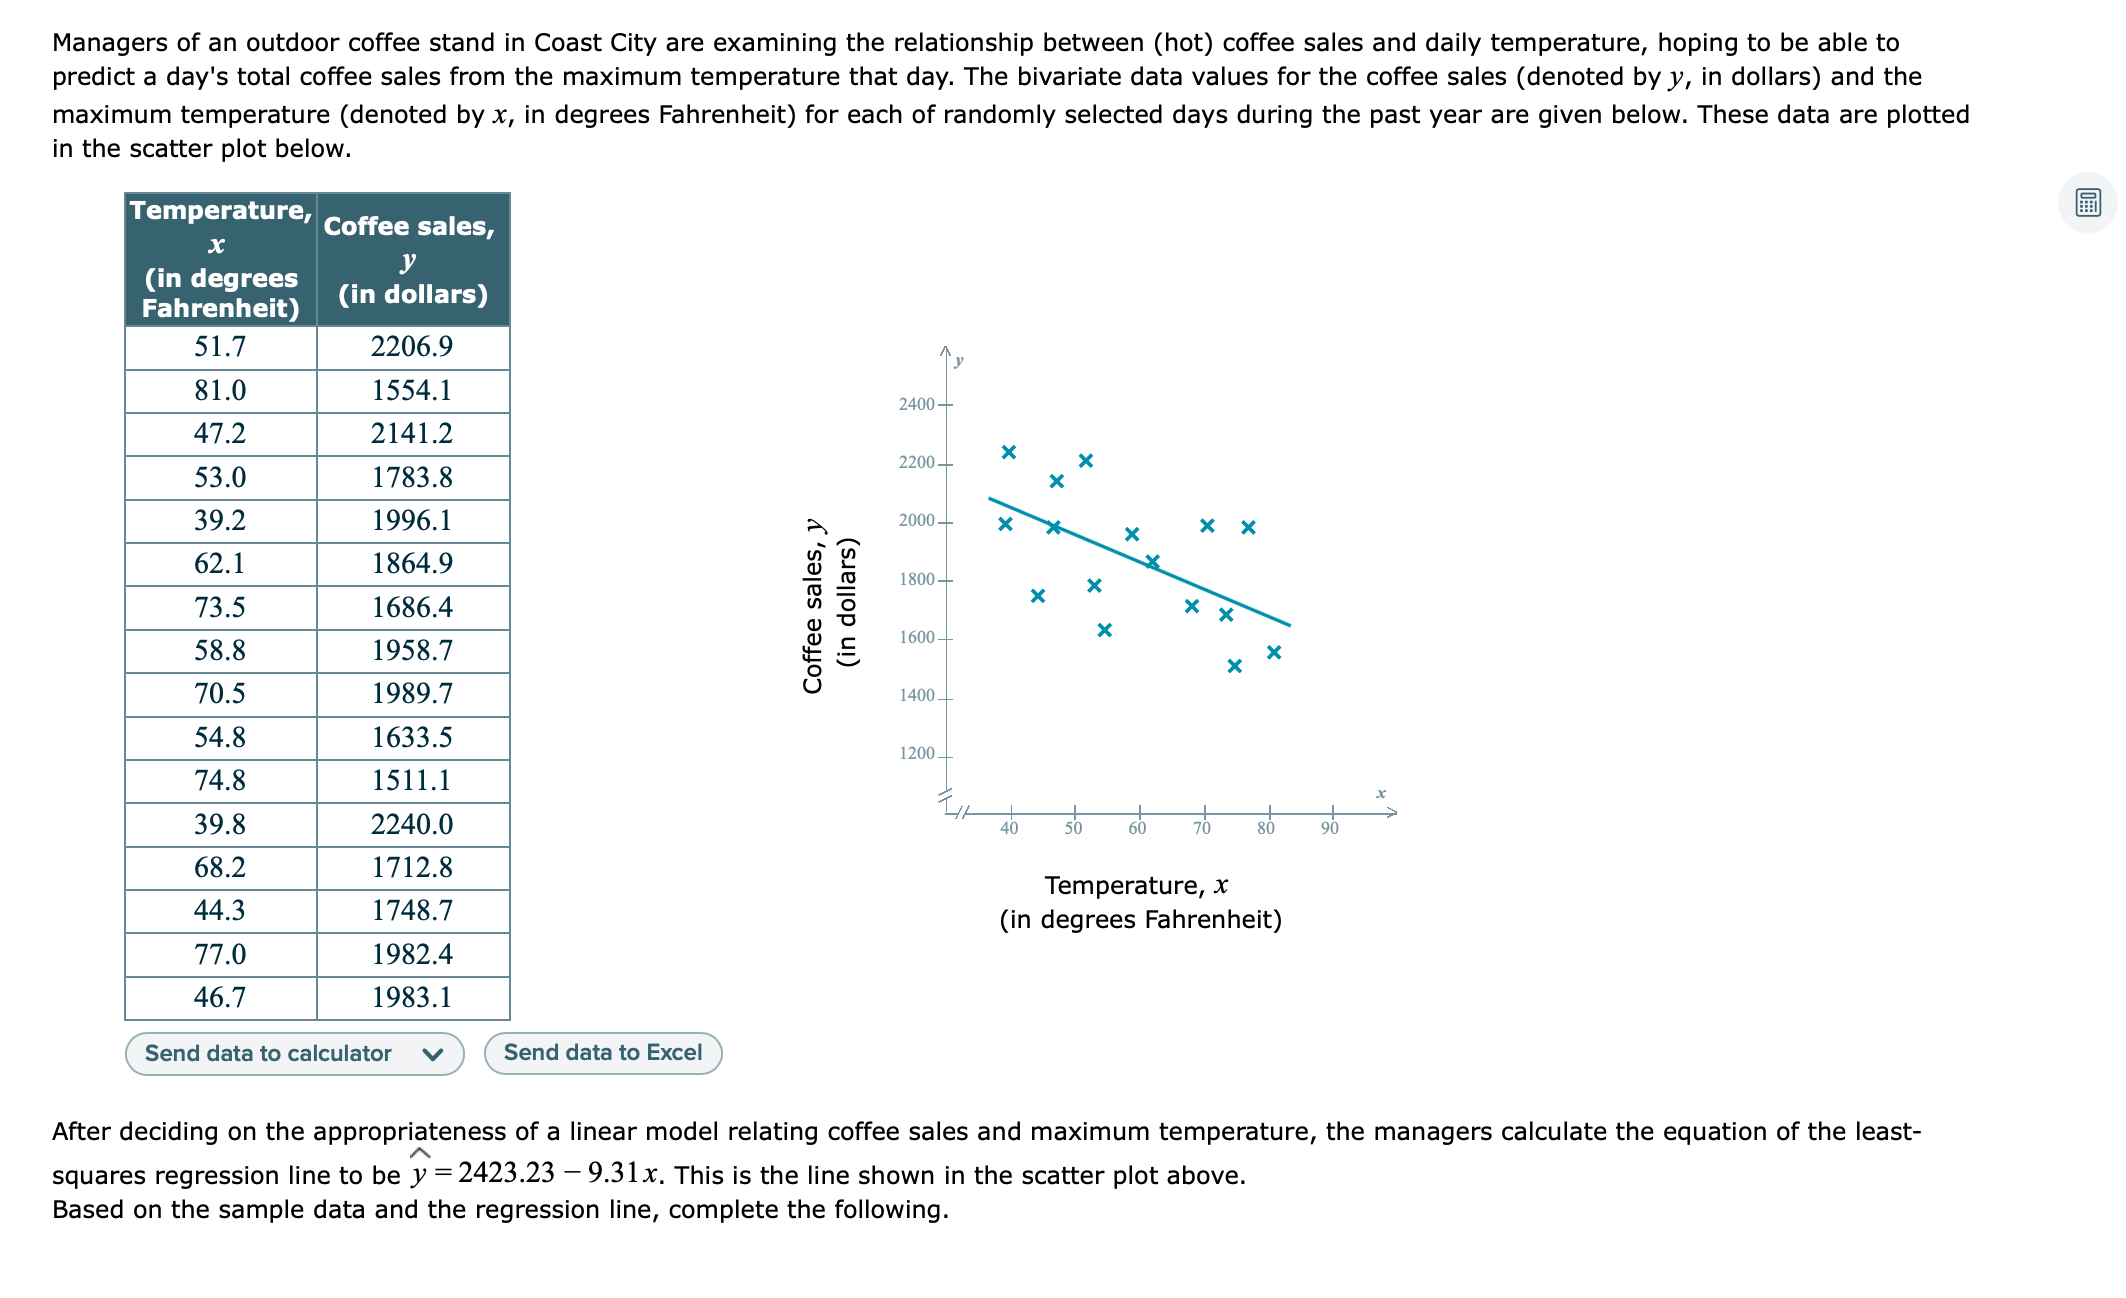
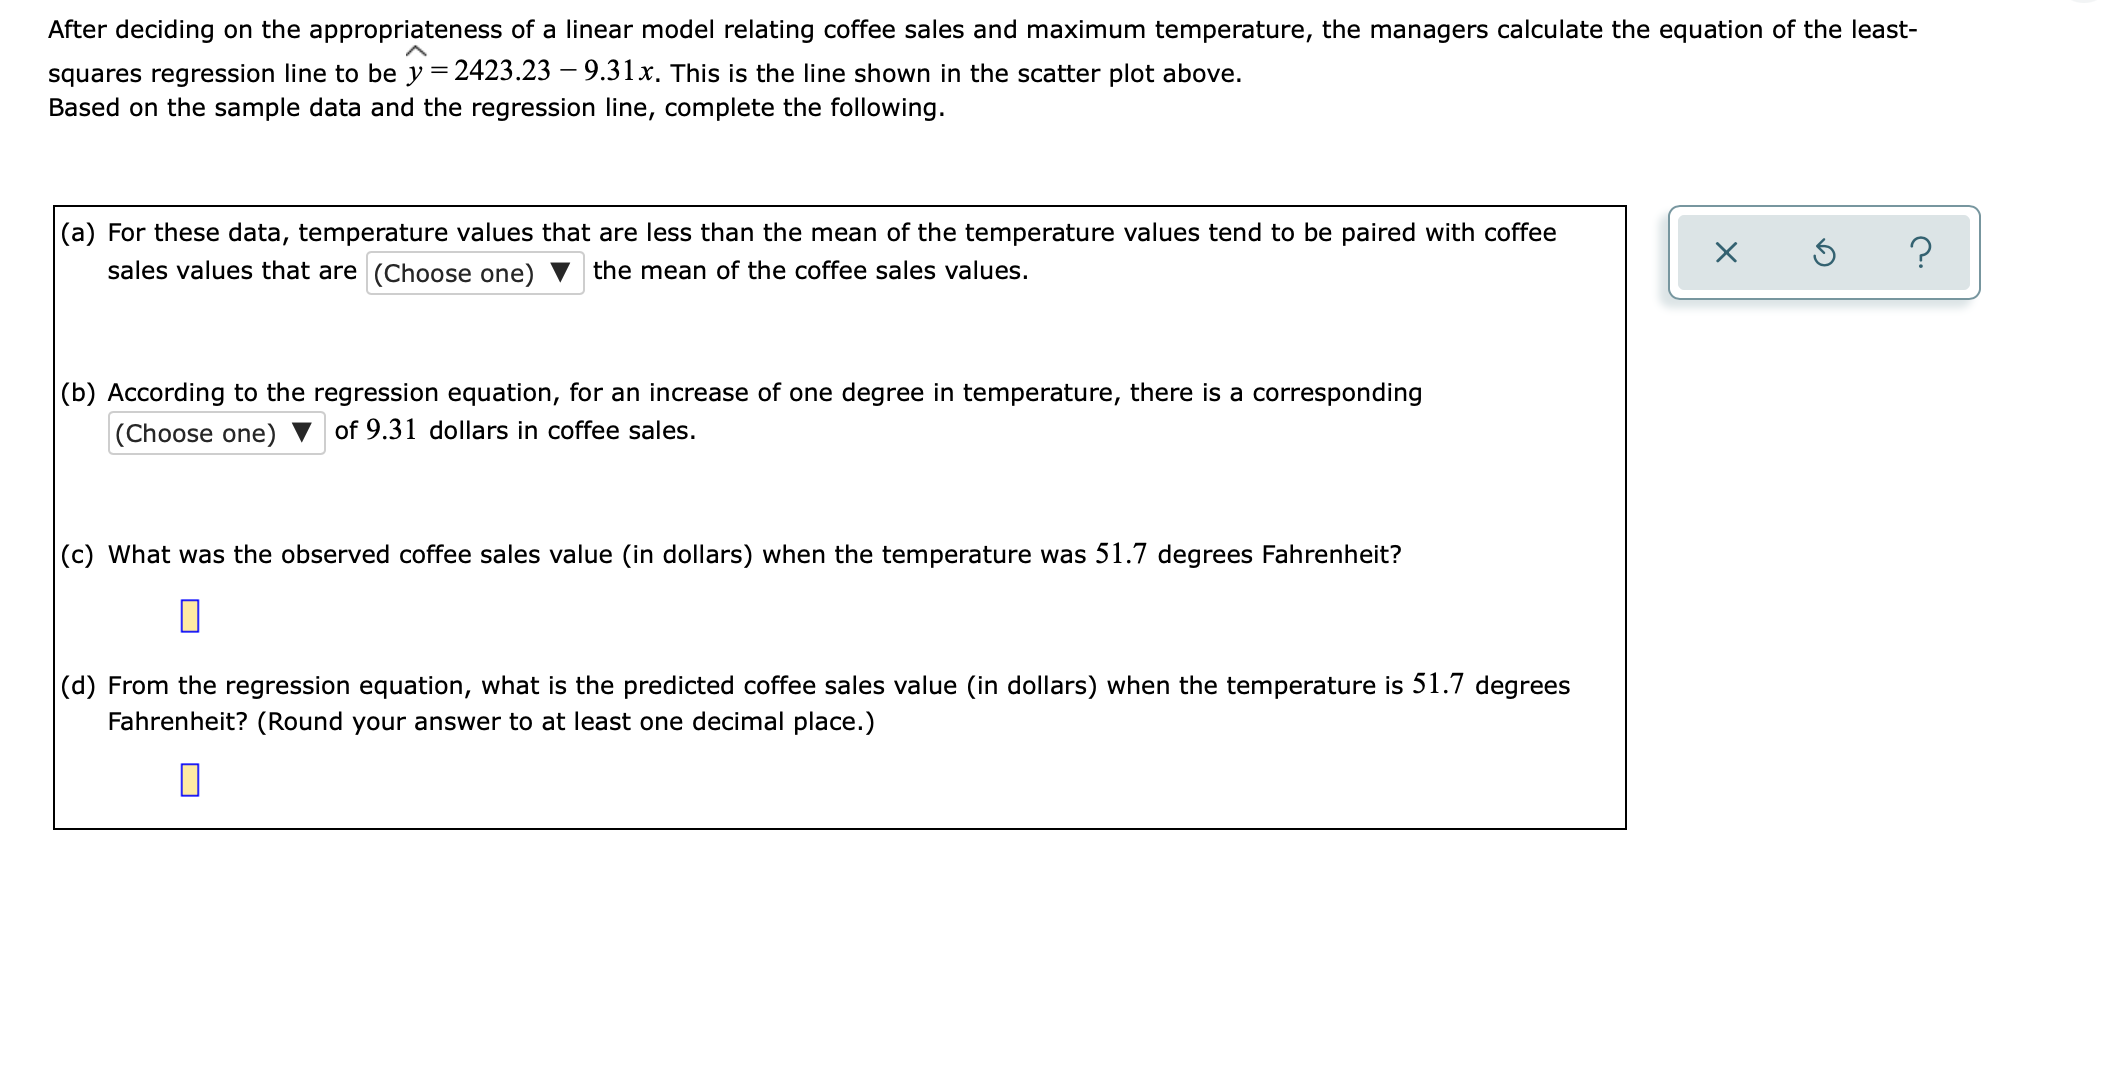
Managers of an outdoor coffee stand in Coast City are examining the relationship between (hot) coffee sales and daily temperature, hoping to be able to predict a day's total coffee sales from the maximum temperature that day. The bivariate data values for the coffee sales (denoted by y, in dollars) and the maximum temperature (denoted by x, in degrees Fahrenheit) for each of randomly selected days during the past year are given below. These data are plotted in the scatter plot below. Temperature' Coffee sales, x . y (In degrees . Fahrenheit) 0" dollars) 51.7 2206.9 y 81.0 1554.1 m 47.2 2141.2 53.0 1783.8 22"" 39.2 1996.1 A 2000 62.1 1864.9 g E\" m 73.5 1686.4 3 g 58.8 1958.7 g .5 15\"\" 70.5 1989.7 U 1400 54.8 1633.5 12.... 74.8 1511.1 7 x 398 2240.0 4 40 SO 60 7U 80 9|] 68.2 1712.8 Tem peratu re, X 443 17487 (in degrees Fahrenheit) 77.0 1982.4 46.7 1983.1 Send data to calculator v Send data to Excel J After deciding on the appropriateness of a linear model relating coffee sales and maximum temperature, the managers calculate the equation of the least- A squares regression line to be y =2423.23 - 9.3126. This is the line shown in the scatter plot above. Based on the sample data and the regression line, complete the following. After deciding on the appropriateness of a linear model relating coffee sales and maximum temperature, the managers calculate the equation of the least- A squares regression line to be y = 2423.23 - 93:13:. This is the line shown in the scatter plot above. Based on the sample data and the regression line, complete the following. (a) For these data, temperature values that are less than the mean of the temperature values tend to be paired with coffee sales values that are (choose one) V the mean of the coffee sales values. (b) According to the regression equation, for an increase of one degree in temperature, there is a corresponding (Choose one) V of 9.31 dollars in coffee sales. (c) What was the observed coffee sales value (in dollars) when the temperature was 51.7 degrees Fahrenheit? D (d) From the regression equation, what is the predicted coffee sales value (in dollars) when the temperature is 51.7 degrees Fahrenheit? (Round your answer to at least one decimal place.) D