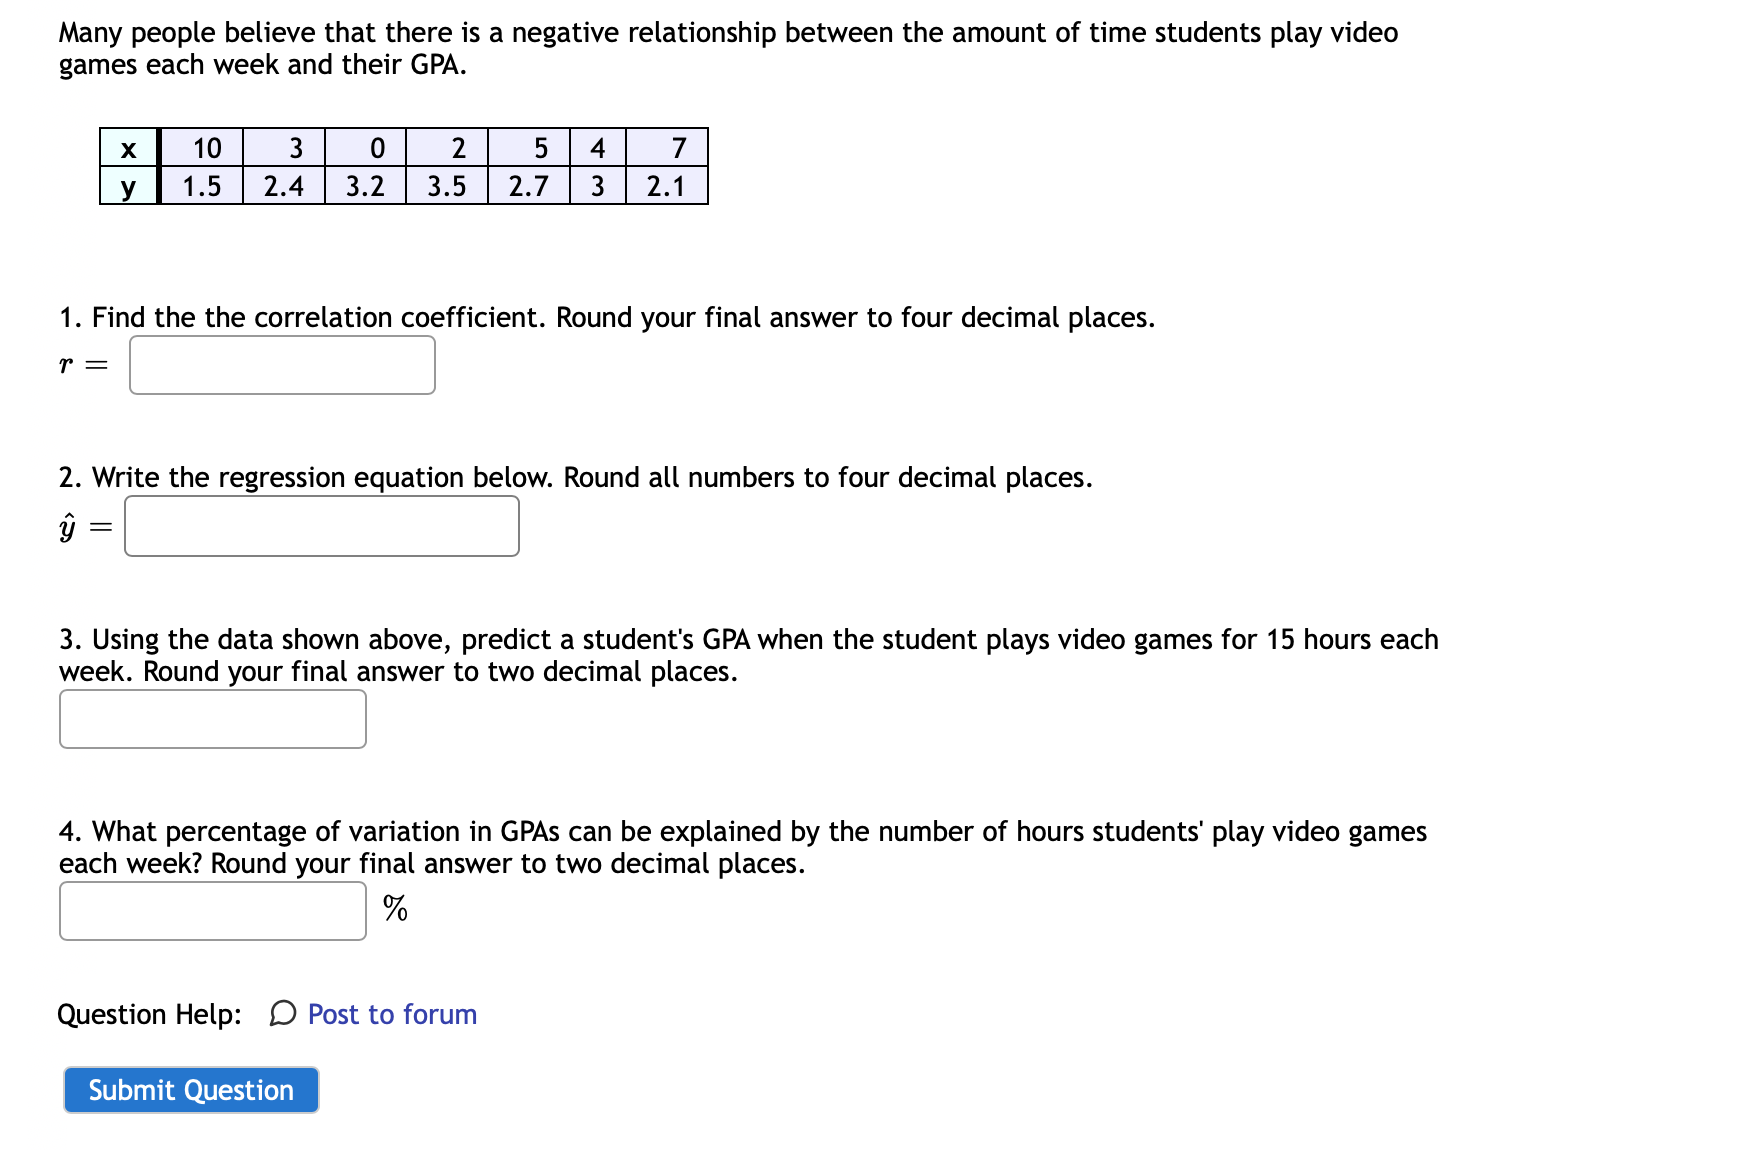
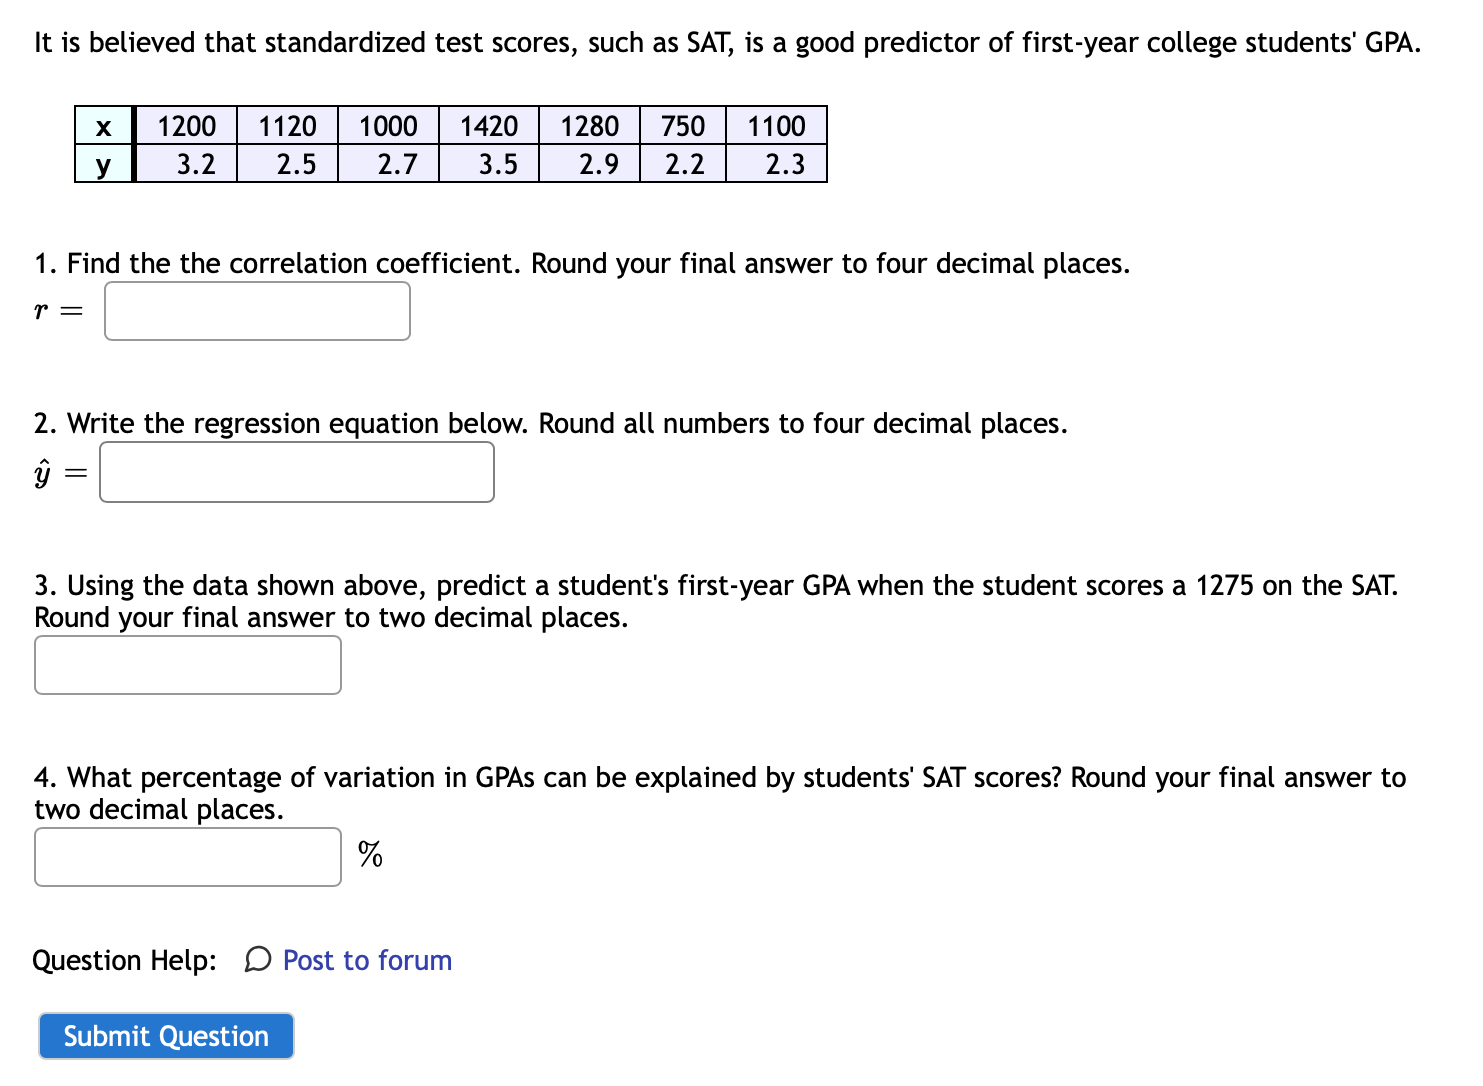
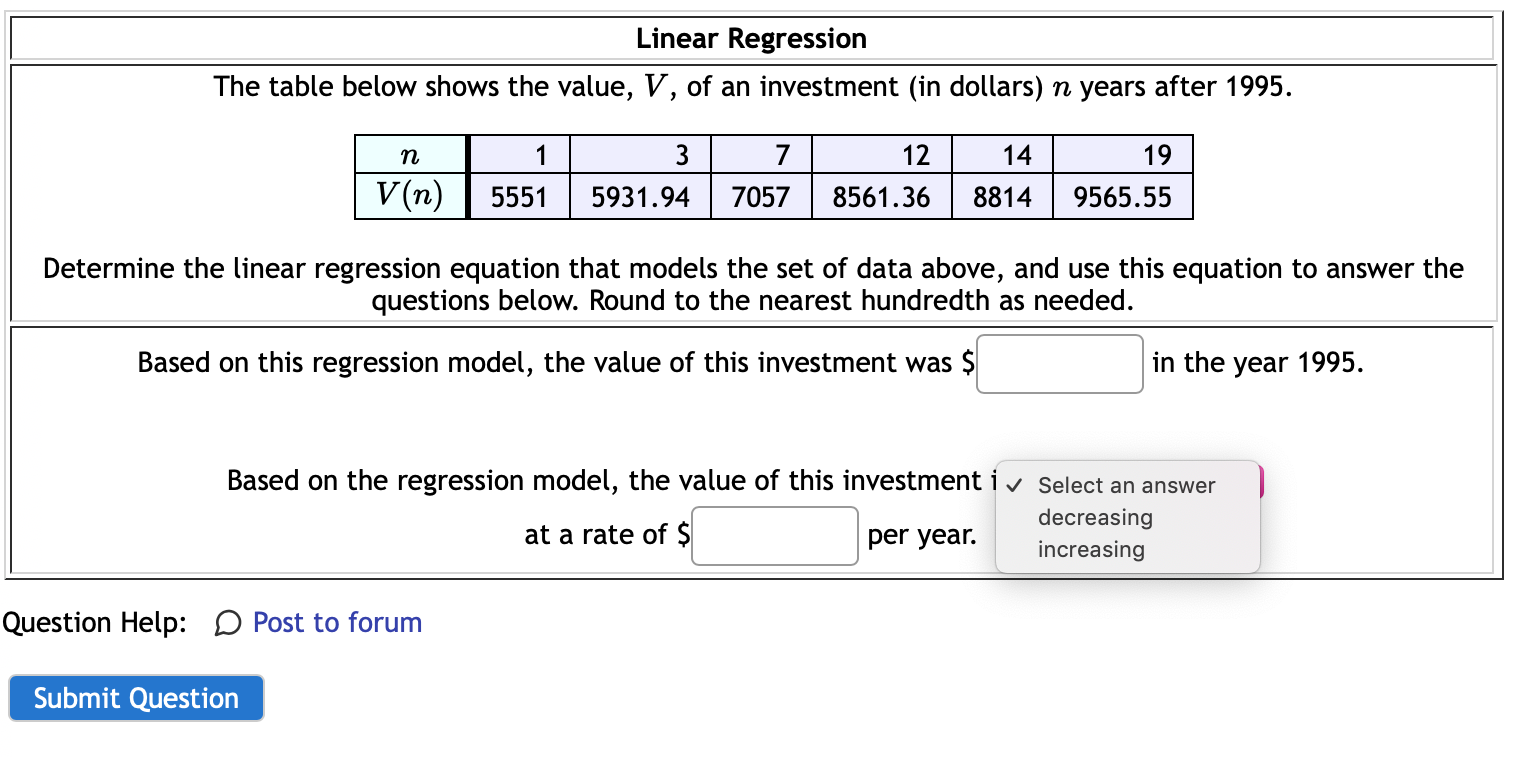
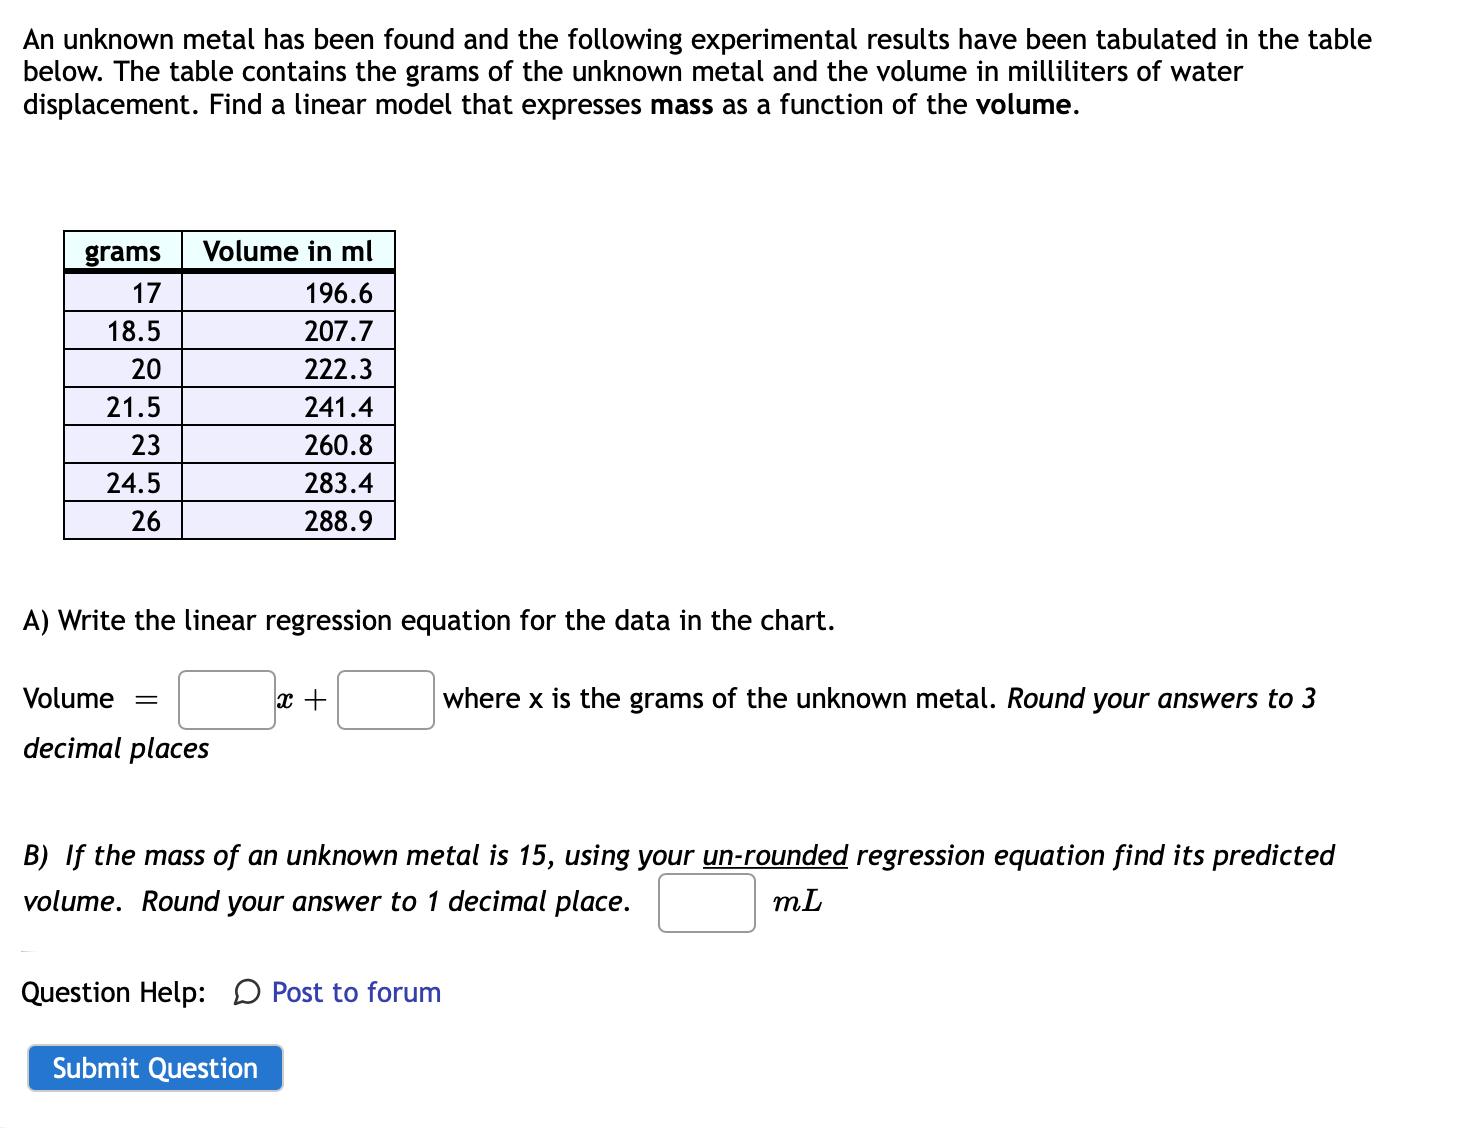
Many people believe that there is a negative relationship between the amount of time students play video games each week and their GPA. x 10 3 0 2 5 4 y 1.5 2.4 3.2 3.5 2.7 3 2.1 1. Find the the correlation coefficient. Round your final answer to four decimal places. 2. Write the regression equation below. Round all numbers to four decimal places. a 3. Using the data shown above, predict a student's GPA when the student plays video games for 15 hours each week. Round your final answer to two decimal places. :1 4. What percentage of variation in GPAs can be explained by the number of hours students' play video games each week? Round your final answer to two decimal places. :% Question Help: C Post to forum Submit Question *2) It is believed that standardized test scores, such as SAT, is a good predictor of first-year college students' GPA. [In-MIMI mm- 1. Find the the correlation coefficient. Round your final answer to four decimal places. 2. Write the regression equation below. Round all numbers to four decimal places. 3. Using the data shown above, predict a student's first-year GPA when the student scores a 1275 on the SAT. Round your final answer to two decimal places. :1 4. What percentage of variation in GPAs can be explained by students' SAT scores? Round your final answer to two decimal places. Eve Question Help: D Post to forum Submit Question 1'3) Linear Regression The table below shows the value, V, of an investment (in dollars) n years after 1995. n 1 3 7 12 14 19 V (n) 5551 5931.94 7057 8561.36 8814 9565.55 Determine the linear regression equation that models the set of data above, and use this equation to answer the questions below. Round to the nearest hundredth as needed. Based on this regression model, the value of this investment was $ in the year 1995. Based on the regression model, the value of this investment i v Select an answer at a rate of $ decreasing per year. increasing Question Help: D Post to forum Submit QuestionAn unknown metal has been found and the following experimental results have been tabulated in the table below. The table contains the grams of the unknown metal and the volume in milliliters of water displacement. Find a linear model that expresses mass as a function of the volume. m Volume in ml A) Write the linear regression equation for the data in the chart. Volume = D11! + I: where x is the grams of the unknown metal. Round your answers to 3 decimal places B) if the mass of an unknown metal is 15, using your un-rounded regression equation find its predicted volume. Round your answer to 1 decimal place. I: mL Question Help: D Post to forum Submit Question You run a regression analysis on data with two variables and you obtain the regression equation y = 1.79133 + 36.283 with a correlation coefficient of 'r = 0.932. You want to predict the value for the response variable for a value of 60 as the explanatory variable. What is the predicted response value? (Report answer accurate to one decimal place.) Question Help: D Post to forum Submit Question Select all the residual plots that violate the conditions for linear regression. .. .... (a) (b) (c) (d) (e) (f) Ob Oc Od De Of Question Help: Video D Post to forumThe linear for predicting poverty is as follows: poverty = 64.68 - 0.62 . HS~grad~rate High school graduation rate for North Carolina is 81.4% and the poverty rate is 13.1%. What is the residual for this observation? Choose the closest answer. 18 16 14 % in poverty 12 10 8 6 80 85 90 % HS grad O1.1 O-24.8 O24.8 O -1.1Aidan is investigating how long his phone's battery lasts (in hours) for various brightness levels (on a scale of 0- 100). His data is displayed in the table and graph below. -III- What is the residual for the point (31 ,7.1 )? Round to 4 decimal places. Question Help: Video Q Post to forum Submit Question Sixteen student volunteers at Ohio State University drank a randomly assigned number of cans of beer. Thirty minutes later, a police officer measured their blood alcohol content (BAC) in grams of alcohol per deciliter of blood. Given is a scatterplot displaying the relationship between BAC and number of cans of beer as well as the linear model for predicting BAC. If the student who drank the most number of beers (9 beers) actually had a BAC of 0.15 grams/deciliter, how would the strength of the association change? 0.15 . . 1.. . . . . . . .. .. 0. 10 . . . . . . .. BAC 0.05 . . ; .. . .. . . . .. . . . .. . . . . . . . ... 2 4 6 8 Cans of beer Decrease Increase Stay the sameJohn's parents recorded his height at various ages up to 66 months. They decide to use the least-squares regression line of John's height on age to predict his height at age 21 years (252 months). We conclude: IA John's height, in inches, should be about half his age, in months. A such a prediction could be misleading, because it involves extrapolation. A that the parents will get a fairly accurate estimate of his height at age 21 years because the data are clearly correlated. IA none of the above. Question Help: D Post to forum Submit