

Answered step by step
Verified Expert Solution
Question
1 Approved Answer
Margin Analysis Being able to calculate a healthy Margin Analysis will help the Research & Development Department understand how to change the cost of material
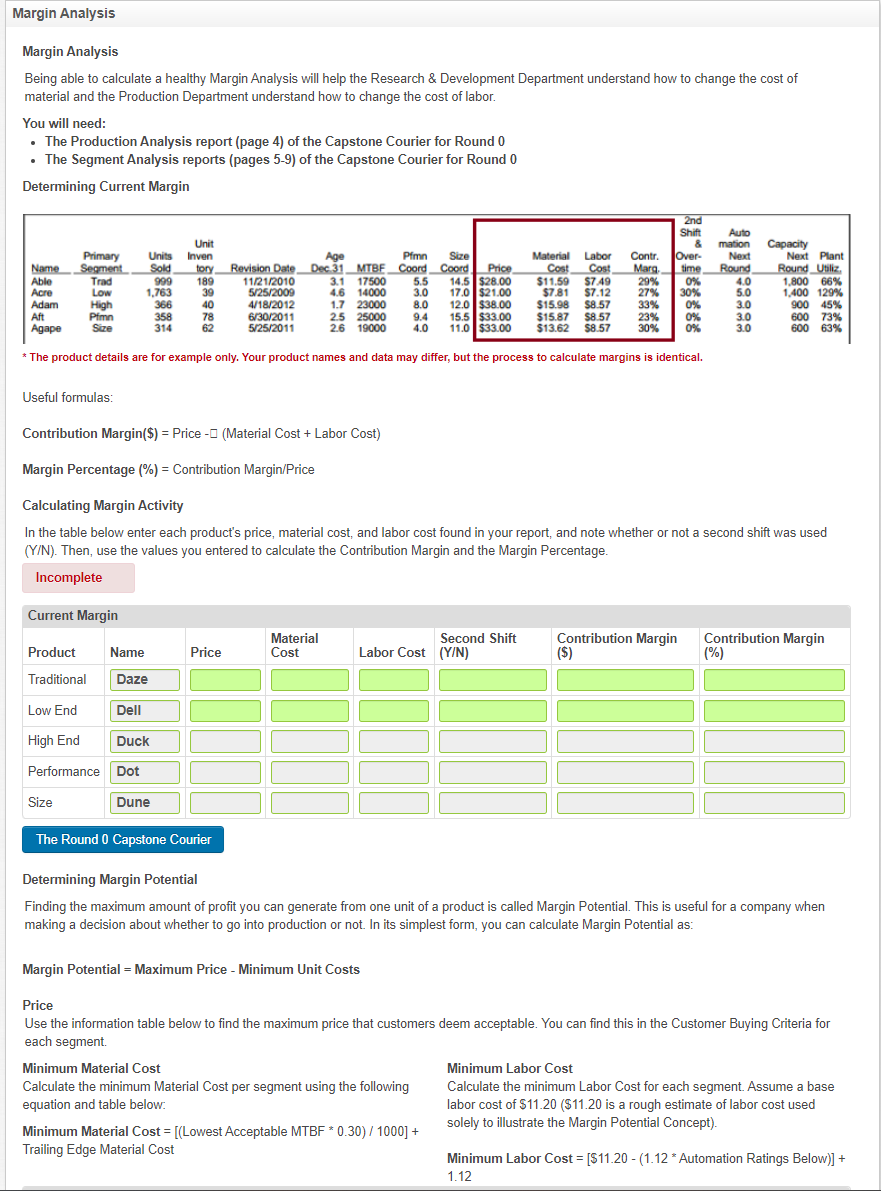
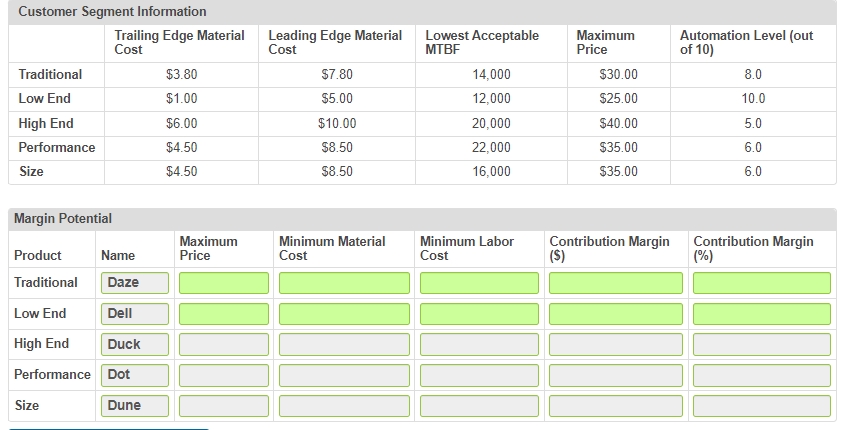 Margin Analysis Being able to calculate a healthy Margin Analysis will help the Research \& Development Department understand how to change the cost of material and the Production Department understand how to change the cost of labor. You will need: - The Production Analysis report (page 4) of the Capstone Courier for Round 0 - The Segment Analysis reports (pages 5-9) of the Capstone Courier for Round 0 Determining Current Margin * The product details are for example only. Your product names and data may differ, but the process to calculate margins is identical. Useful formulas: Contribution Margin(\$) = Price (Material Cost + Labor Cost) Margin Percentage (%)= Contribution Margin/Price Calculating Margin Activity In the table below enter each product's price, material cost, and labor cost found in your report, and note whether or not a second shift was used (Y/N). Then, use the values you entered to calculate the Contribution Margin and the Margin Percentage. Determining Margin Potential Finding the maximum amount of profit you can generate from one unit of a product is called Margin Potential. This is useful for a company when making a decision about whether to go into production or not. In its simplest form, you can calculate Margin Potential as: Margin Potential = Maximum Price - Minimum Unit Costs Price Use the information table below to find the maximum price that customers deem acceptable. You can find this in the Customer Buying Criteria for each segment. Minimum Material Cost Calculate the minimum Material Cost per segment using the following equation and table below: Minimum Material Cost =[( Lowest Acceptable MTBF * 0.30) /1000]+ Trailing Edge Material Cost Minimum Labor Cost Calculate the minimum Labor Cost for each segment. Assume a base labor cost of $11.20 ( $11.20 is a rough estimate of labor cost used solely to illustrate the Margin Potential Concept). Minimum Labor Cost =[$11.20(1.12 Automation Ratings Below )]+ 1.12 Customer Segment Information \begin{tabular}{|c|c|c|c|c|c|} \hline & \begin{tabular}{l} Trailing Edge Material \\ Cost \end{tabular} & \begin{tabular}{l} Leading Edge Material \\ Cost \end{tabular} & \begin{tabular}{l} Lowest Acceptable \\ MTBF \end{tabular} & \begin{tabular}{l} Maximum \\ Price \end{tabular} & \begin{tabular}{l} Automation Level (out \\ of 10) \end{tabular} \\ \hline Traditional & $3.80 & $7.80 & 14,000 & $30.00 & 8.0 \\ \hline Low End & $1.00 & $5.00 & 12,000 & $25.00 & 10.0 \\ \hline High End & $6.00 & $10.00 & 20,000 & $40.00 & 5.0 \\ \hline Performance & $4.50 & $8.50 & 22,000 & $35.00 & 6.0 \\ \hline Size & $4.50 & $8.50 & 16,000 & $35.00 & 6.0 \\ \hline \end{tabular} \begin{tabular}{|l|l|l|l|l|} \hline Margin Potential & \begin{tabular}{l} Maximum \\ Price \end{tabular} & \begin{tabular}{l} Minimum Material \\ Cost \end{tabular} & \begin{tabular}{l} Minimum Labor \\ Cost \end{tabular} & \begin{tabular}{l} Contribution Margin \\ (\$) \end{tabular} \\ \hline Traditional & Dame & \begin{tabular}{l} Contribution Margin \\ (\%) \end{tabular} \\ \hline Low End & Dell \\ \hline High End & Duck \\ \hline Performance & Dot \\ \hline Size & Dune \\ \hline \end{tabular}
 Step by Step Solution
There are 3 Steps involved in it
Step: 1

Get Instant Access to Expert-Tailored Solutions
See step-by-step solutions with expert insights and AI powered tools for academic success
Step: 2

Step: 3
Ace Your Homework with AI
Get the answers you need in no time with our AI-driven, step-by-step assistance
Get Started
The AMA Handbook Of Financial Risk Management
Authors: John J. Hampton
1st Edition
0814417442, 978-0814417447