Answered step by step
Verified Expert Solution
Question
1 Approved Answer
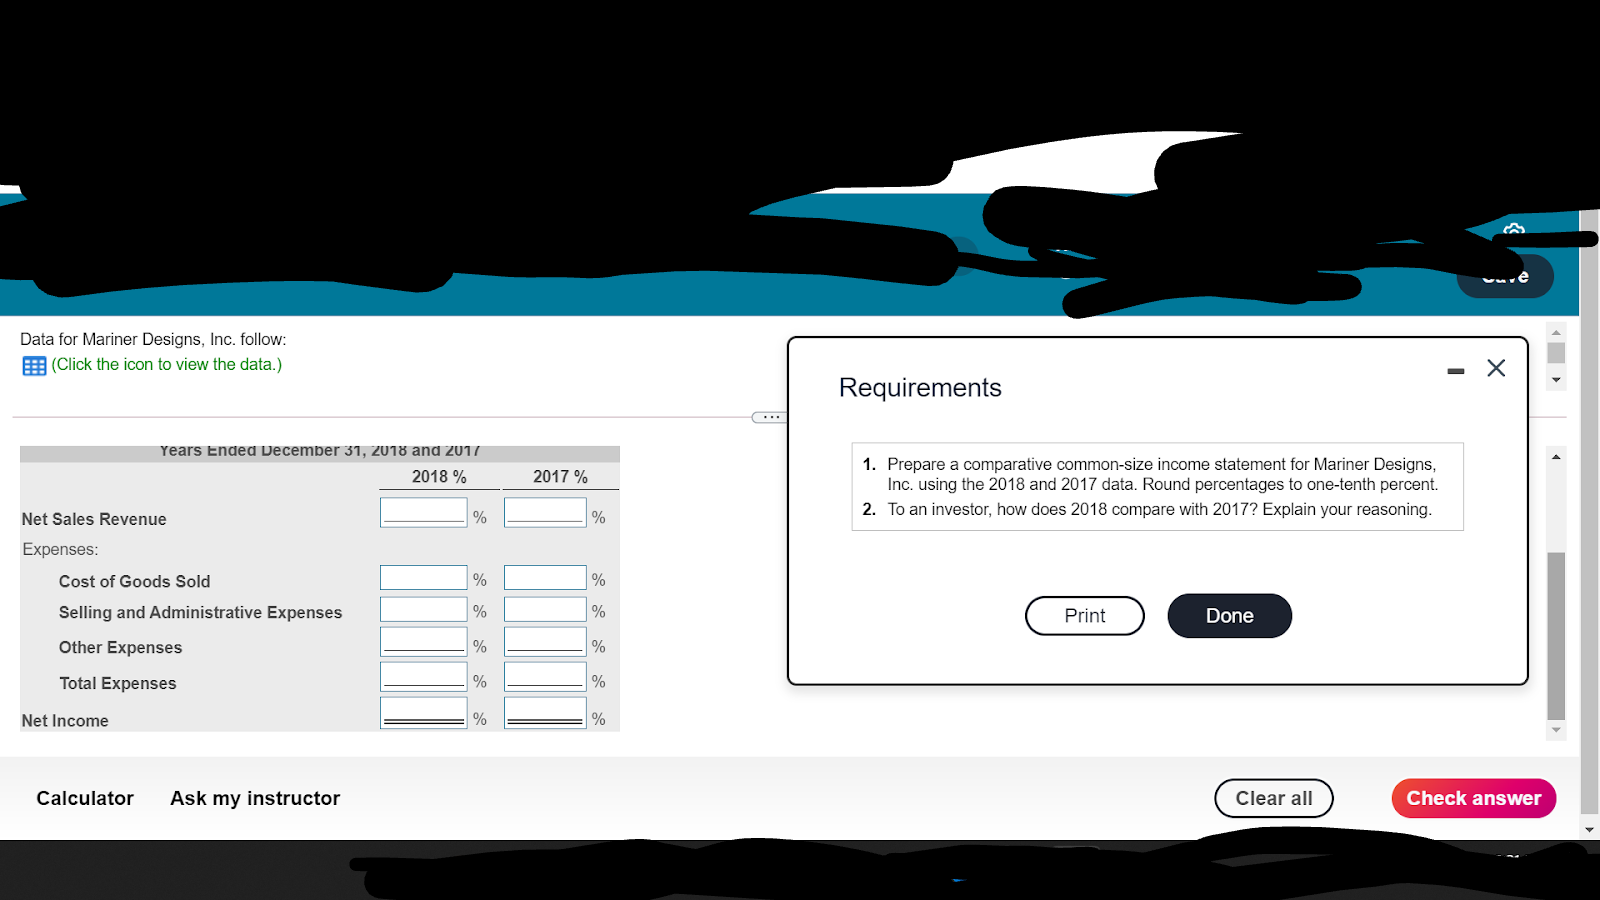
Mariner Designs, Inc. Comparative Income Statement Years Ended December 31, 2018 and 2017 2018 2017 Net Sales Revenue $431,250 $371,000 Expenses: Cost of Goods Sold

| Mariner Designs, Inc. | ||
| Comparative Income Statement | ||
| Years Ended December 31, 2018 and 2017 | ||
|
| 2018 | 2017 |
|---|---|---|
| Net Sales Revenue | $431,250 | $371,000 |
| Expenses: |
|
|
| Cost of Goods Sold | 201,550 | 186,250 |
| Selling and Administrative Expenses | 97,450 | 92,750 |
| Other Expenses | 5,000 | 2,150 |
| Total Expenses | 304,000 | 281,150 |
| Net Income | $127,250 | $89,850 |
Dialog content ends
PrintDone
we Data for Mariner Designs, Inc. follow: (Click the icon to view the data.) Requirements ... Years Ended December 31, 2018 and 2017 2018 % 2017 % 1. Prepare a comparative common-size income statement for Mariner Designs, Inc. using the 2018 and 2017 data. Round percentages to one-tenth percent. 2. To an investor, how does 2018 compare with 2017? Explain your reasoning. % % Net Sales Revenue Expenses: % % Cost of Goods Sold Selling and Administrative Expenses Other Expenses % % Print Done % % Total Expenses % % Net Income % % Calculator Ask my instructor Clear all CheckStep by Step Solution
There are 3 Steps involved in it
Step: 1

Get Instant Access to Expert-Tailored Solutions
See step-by-step solutions with expert insights and AI powered tools for academic success
Step: 2

Step: 3

Ace Your Homework with AI
Get the answers you need in no time with our AI-driven, step-by-step assistance
Get Started


