Answered step by step
Verified Expert Solution
Question
1 Approved Answer
Average water level and discharge from multiple measurements over a period of time produced 22 paired water level and discharge data. This was used


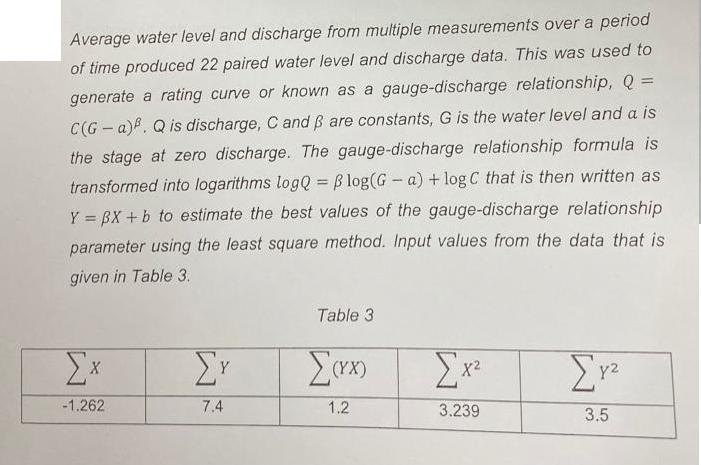
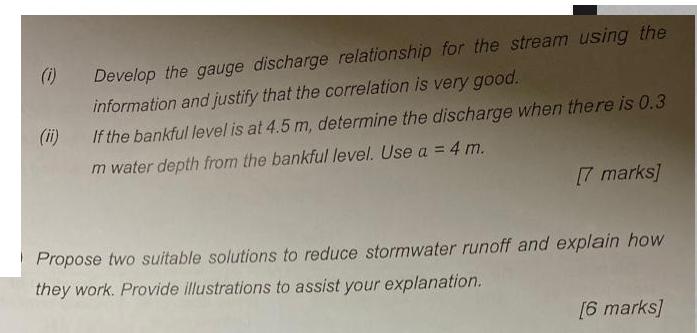
Average water level and discharge from multiple measurements over a period of time produced 22 paired water level and discharge data. This was used to generate a rating curve or known as a gauge-discharge relationship, Q = C(G-a). Q is discharge, C and B are constants, G is the water level and a is the stage at zero discharge. The gauge-discharge relationship formula is transformed into logarithms logQ= Blog(G-a) + log C that is then written as Y = BX + b to estimate the best values of the gauge-discharge relationship parameter using the least square method. Input values from the data that is given in Table 3. Ex X -1.262 7.4 Table 3 (YX) 1.2 [x 3.239 [Y 3.5 (i) (ii) Develop the gauge discharge relationship for the stream using the information and justify that the correlation is very good. If the bankful level is at 4.5 m, determine the discharge when there is 0.3 m water depth from the bankful level. Use a = 4 m. [7 marks] Propose two suitable solutions to reduce stormwater runoff and explain how they work. Provide illustrations to assist your explanation. [6 marks]
Step by Step Solution
★★★★★
3.38 Rating (145 Votes )
There are 3 Steps involved in it
Step: 1
To develop the gauge discharge relationship for the stream we use a linear regression approach typically known as the least squares method to find the ...
Get Instant Access to Expert-Tailored Solutions
See step-by-step solutions with expert insights and AI powered tools for academic success
Step: 2

Step: 3

Ace Your Homework with AI
Get the answers you need in no time with our AI-driven, step-by-step assistance
Get Started


