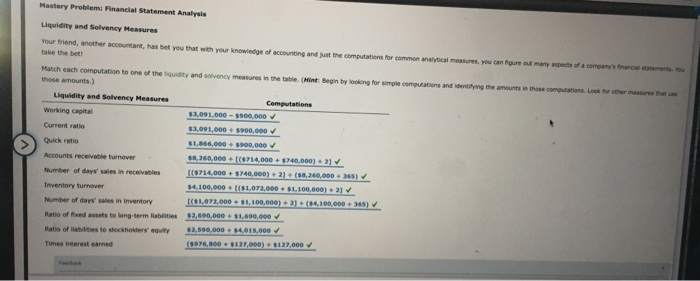
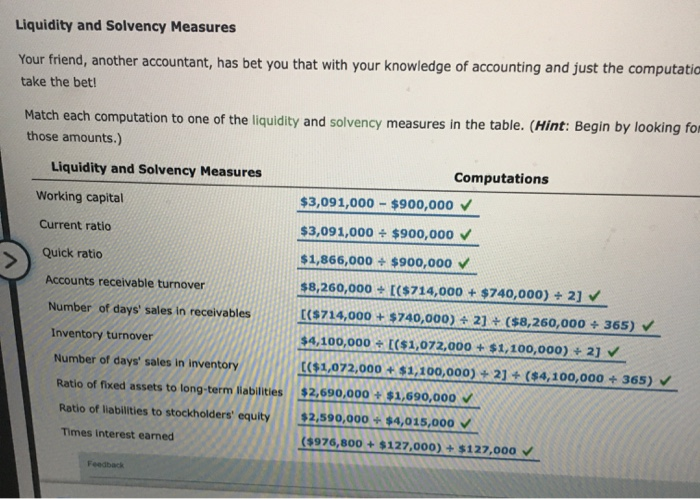
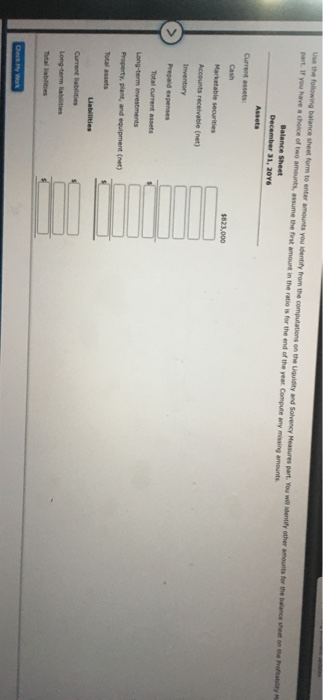
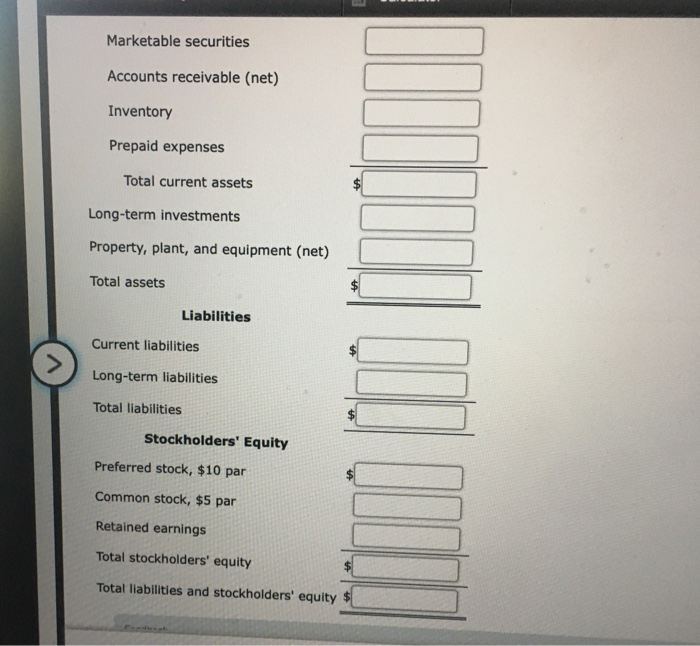
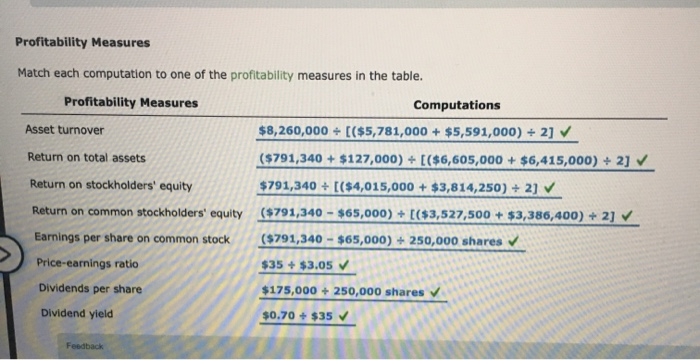
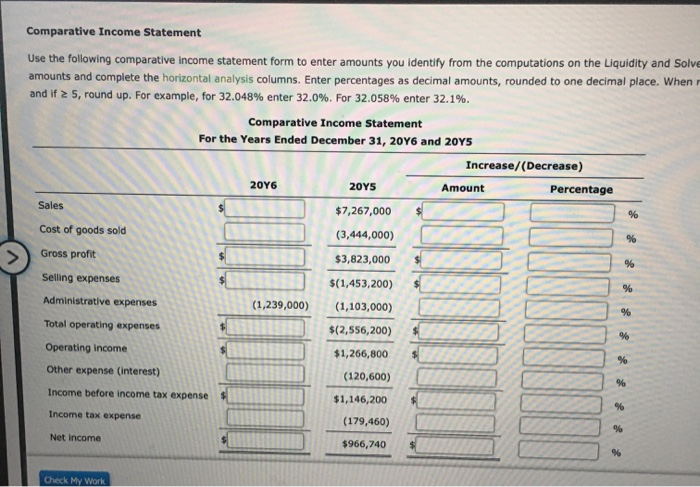
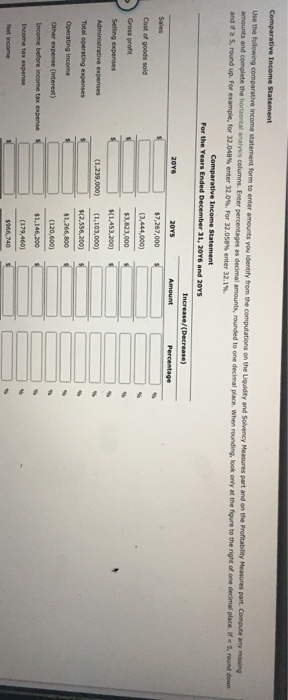
Mastery Problemi Financial Statement Analysis Liquidity and Solvency Measures Your friend, another accountant, has bet you that with your knowledge of accounting and take the beti the computations for common analytical measures, you can figure out many aspects of a company's financial statements You Match each computation to one of the body and solvency measures in the tablet: Begin by long forme comicond those amounts.) entifying the amounts in the companions. Look for the meet Liquidity and Solvency Measures Computations Working capital $3,091,000 - $900,000 $3,091,000 $900,000 Quick ratio $1,000,000 $900,000 Accounts receivable turnover 58,260,000 $714,000 740,000) Number of days' sales in recevables (5714,000 + $740,000) + 2) (88,260.000 365) Inventory turnover $4,100,000 (81,072,000 $1,100,000) Number of days sales in inventory [61,073,000 $1,100,000) )+ (14,100,000 343) Ratio of fixed assets to long-term librities $2,690.000 1.690,000 Ratio of liabilities to stockholders' equity $2,590,000+ $4,015.000 Times interest earned (5976,600 127,000) $137,000 Liquidity and Solvency Measures Your friend, another accountant, has bet you that with your knowledge of accounting and just the computatic take the bet! Match each computation to one of the liquidity and solvency measures in the table. (Hint: Begin by looking for those amounts.) Liquidity and Solvency Measures Working capital Computations $3,091,000 - $900,000 Current ratio $3,091,000 = $900,000 Quick ratio Accounts receivable turnover Number of days' sales in receivables Inventory turnover Number of days' sales in inventory Ratio of fixed assets to long-term liabilities Ratio of liabilities to stockholders' equity Times interest earned $1,866,000 + $900,000 $8,260,000+ [($714,000 + $740,000) + 2] [(5714,000 - $240,000) 4 2] + ($8,260,000 + 365) $4,100,000+ [($1,072,000+ $1,100,000) + 2] [($1,072,000 $1,100,000) + 2) + ($4,100,000 + 365) $2,690,000+ $1,690,000 NUN $2,590,000+ $4,015,000 800 + $127.000) + $127,000 Feedback Marketable securities Accounts receivable (net) Inventory Prepaid expenses Total current assets Long-term investments Property, plant, and equipment (net) Total assets Liabilities Current liabilities Long-term liabilities Total liabilities Stockholders' Equity Preferred stock, $10 par Common stock, $5 par Retained earnings Total stockholders' equity Total liabilities and stockholders' equity $ Profitability Measures Match each computation to one of the profitability measures in the table. Profitability Measures Computations Asset turnover $8,260,000+ [($5,781,000+ $5,591,000) + 2] Return on total assets ($791,340 + $127,000) + [($6,605,000+ $6,415,000) + 2] Return on stockholders' equity $791,340 + [($4,015,000 + $3,814,250) + 2] ($791,340 - $65,000) + (($3,527,500 + $3,386,400) + 2] ($791,340 - $65,000) + 250,000 shares Return on common stockholders' equity Earnings per share on common stock Price-earnings ratio Dividends per share $35 + $3.05 + 250,000 shares Dividend yield Feedback Comparative Income Statement Use the following comparative Income statement form to enter amounts you identify from the computations on the Liquidity and Solve amounts and complete the horizontal analysis columns. Enter percentages as decimal amounts, rounded to one decimal place. When and if 5, round up. For example, for 32.048% enter 32.0%. For 32.058% enter 32.1%. Comparative Income Statement For the Years Ended December 31, 2016 and 2015 Increase/(Decrease) 2016 2015 Amount Percentage Sales $7,267,000 $ Cost of goods sold (3,444,000) Gross profit $3,823,000 Selling expenses $(1,453,200) Administrative expenses (1,239,000) (1,103,000) Total operating expenses $(2,556,200) $ Operating Income $1,266,800 Other expense (interest) (120,600) Income before income tax expense $1,146,200 Income tax expense (179,460) Net income $966,740 * * * Check My Work Comparative Income Statement Use the following comparative income statement form to enter amounts you identify from the computations on the Liquidity and Solvency Measures part and on the Profitability Measures part. Compute any mising amounts and complete the horizontal analysis columns. Enter percentages as decimal amounts, rounded to one decimal place. When rounding, look only at the figure to the right of one decimal place i s round down and if 5, round up. For example, for 32.048% enter 32.0%. For 32.058 enter 32.14 Comparative Income Statement For the Years Ended December 31, 2016 and 2015 2015 Increase/(Decrease) Amount Percentage Sales Cost of goods sold $7,267,000 (3,444,000) Gross profit $3.523,000 Selling expenses Administrative expenses $1,453,200) (1 239,000) (1,103,000) Total operating expenses 12,556,200) Operating income $1,266,800 Other expense (interest) (120.600) Income before income tax expense $1,146,200 Income tax expense (179,460) Net Income