Answered step by step
Verified Expert Solution
Question
1 Approved Answer
Mathematical modeling Modelling Tutorial March 17, 2021 An influenza epidemic in a boarding school This example was given by Murray, based on data compiled by


Mathematical modeling
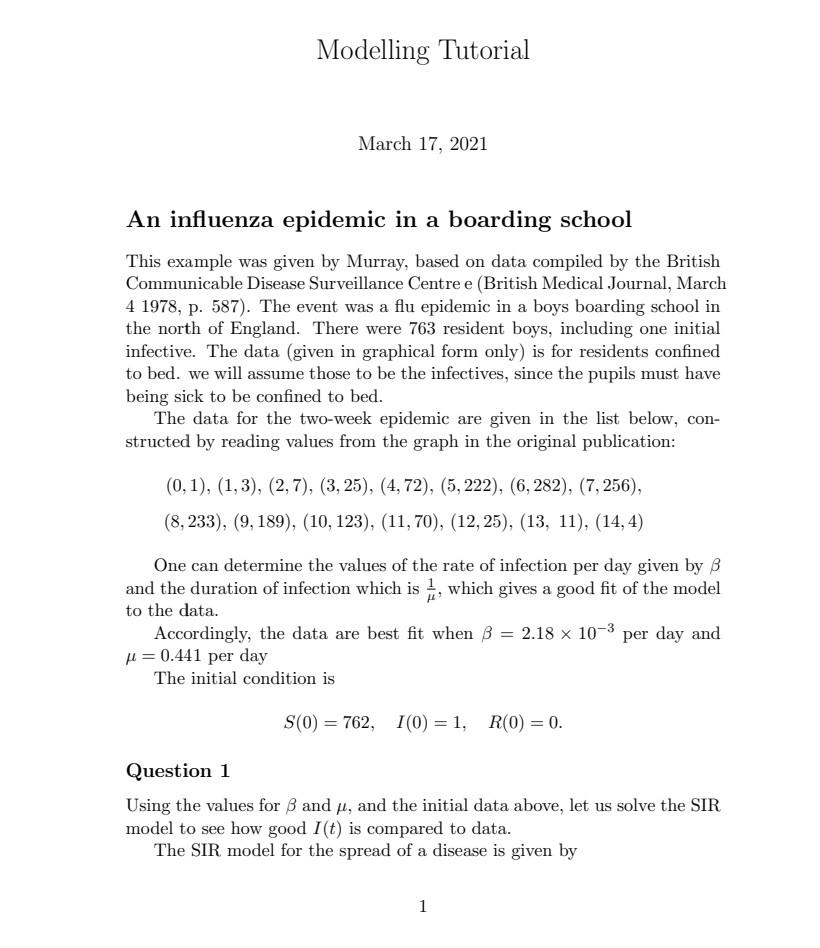
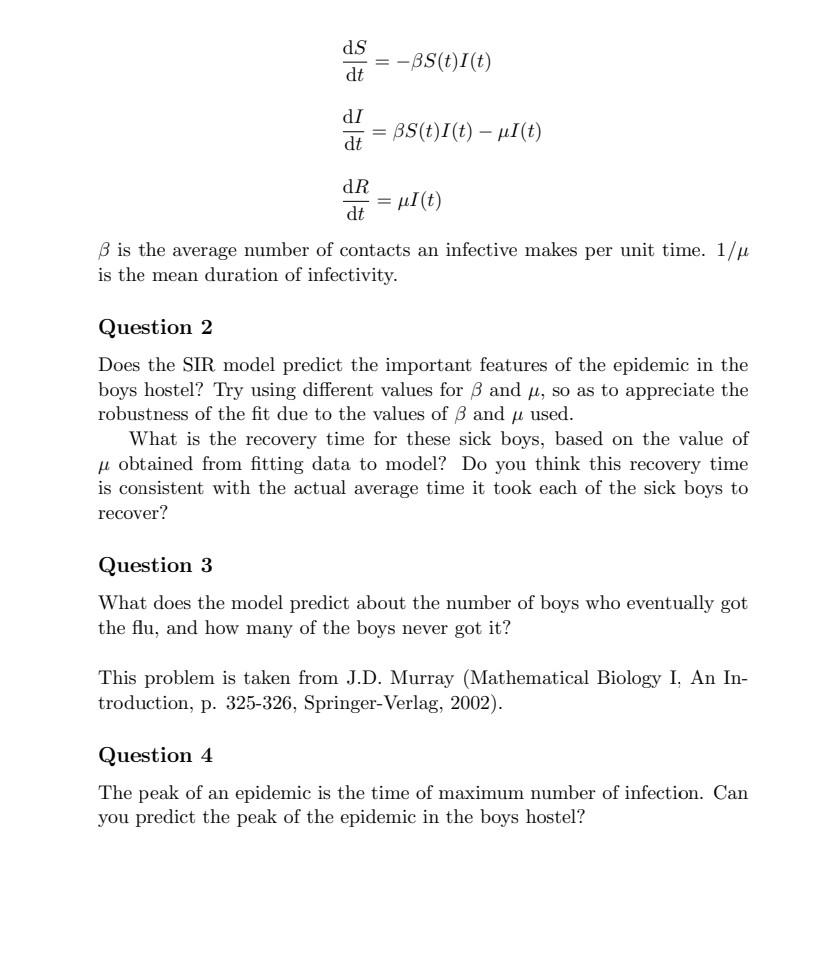
Modelling Tutorial March 17, 2021 An influenza epidemic in a boarding school This example was given by Murray, based on data compiled by the British Communicable Disease Surveillance Centre e (British Medical Journal, March 4 1978, p. 587). The event was a flu epidemic in a boys boarding school in the north of England. There were 763 resident boys, including one initial infective. The data (given in graphical form only) is for residents confined to bed. we will assume those to be the infectives, since the pupils must have being sick to be confined to bed. The data for the two-week epidemic are given in the list below, con- structed by reading values from the graph in the original publication: (0,1), (1,3), (2,7), (3,25), (4,72), (5,222), (6,282), (7,256), (8,233), (9,189), (10,123), (11,70), (12,25), (13, 11), (14,4) One can determine the values of the rate of infection per day given by B and the duration of infection which is 1, which gives a good fit of the model to the data. Accordingly, the data are best fit when B = 2.18 x 10-' per day and u=0.441 per day The initial condition is S(0) = 762, I(0) = 1, R(0) = 0. Question 1 Using the values for B and y, and the initial data above, let us solve the SIR model to see how good I(t) is compared to data. The SIR model for the spread of a disease is given by 1 ds = -BS(t)/(t) dt dI = BS(t)/(t) uI(t) dt dR = HI(t) dt B is the average number of contacts an infective makes per unit time. 1/u is the mean duration of infectivity. Question 2 Does the SIR model predict the important features of the epidemic in the boys hostel? Try using different values for B and , so as to appreciate the robustness of the fit due to the values of B and y used. What is the recovery time for these sick boys, based on the value of u obtained from fitting data to model? Do you think this recovery time is consistent with the actual average time it took each of the sick boys to recover? Question 3 What does the model predict about the number of boys who eventually got the flu, and how many of the boys never got it? This problem is taken from J.D. Murray (Mathematical Biology I. An In- troduction, p. 325-326, Springer-Verlag, 2002). Question 4 The peak of an epidemic is the time of maximum number of infection. Can you predict the peak of the epidemic in the boys hostel? Modelling Tutorial March 17, 2021 An influenza epidemic in a boarding school This example was given by Murray, based on data compiled by the British Communicable Disease Surveillance Centre e (British Medical Journal, March 4 1978, p. 587). The event was a flu epidemic in a boys boarding school in the north of England. There were 763 resident boys, including one initial infective. The data (given in graphical form only) is for residents confined to bed. we will assume those to be the infectives, since the pupils must have being sick to be confined to bed. The data for the two-week epidemic are given in the list below, con- structed by reading values from the graph in the original publication: (0,1), (1,3), (2,7), (3,25), (4,72), (5,222), (6,282), (7,256), (8,233), (9,189), (10,123), (11,70), (12,25), (13, 11), (14,4) One can determine the values of the rate of infection per day given by B and the duration of infection which is 1, which gives a good fit of the model to the data. Accordingly, the data are best fit when B = 2.18 x 10-' per day and u=0.441 per day The initial condition is S(0) = 762, I(0) = 1, R(0) = 0. Question 1 Using the values for B and y, and the initial data above, let us solve the SIR model to see how good I(t) is compared to data. The SIR model for the spread of a disease is given by 1 ds = -BS(t)/(t) dt dI = BS(t)/(t) uI(t) dt dR = HI(t) dt B is the average number of contacts an infective makes per unit time. 1/u is the mean duration of infectivity. Question 2 Does the SIR model predict the important features of the epidemic in the boys hostel? Try using different values for B and , so as to appreciate the robustness of the fit due to the values of B and y used. What is the recovery time for these sick boys, based on the value of u obtained from fitting data to model? Do you think this recovery time is consistent with the actual average time it took each of the sick boys to recover? Question 3 What does the model predict about the number of boys who eventually got the flu, and how many of the boys never got it? This problem is taken from J.D. Murray (Mathematical Biology I. An In- troduction, p. 325-326, Springer-Verlag, 2002). Question 4 The peak of an epidemic is the time of maximum number of infection. Can you predict the peak of the epidemic in the boys hostelStep by Step Solution
There are 3 Steps involved in it
Step: 1

Get Instant Access to Expert-Tailored Solutions
See step-by-step solutions with expert insights and AI powered tools for academic success
Step: 2

Step: 3

Ace Your Homework with AI
Get the answers you need in no time with our AI-driven, step-by-step assistance
Get Started


