

Answered step by step
Verified Expert Solution
Question
1 Approved Answer
Matlab code %% #1 % % WRITE CODE BELOW: % Generate two separate plots: y=x^2 on the interval [0,1], and y=1/x on % the interval
Matlab code
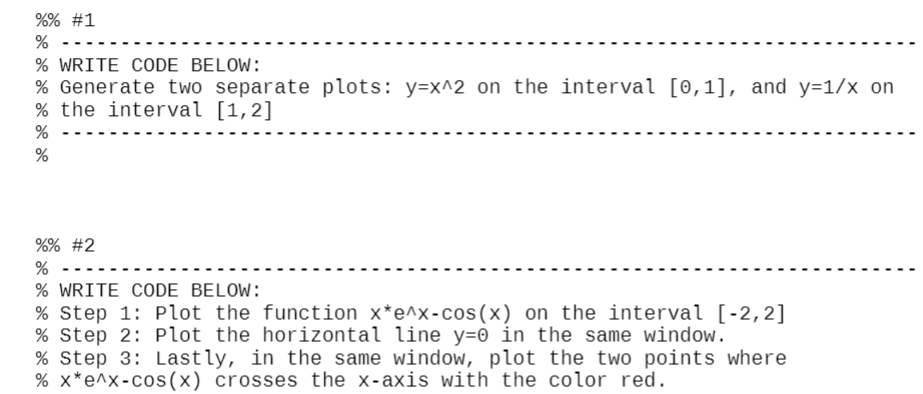
%% #1 % % WRITE CODE BELOW: % Generate two separate plots: y=x^2 on the interval [0,1], and y=1/x on % the interval [1,2] % % %% #2 % % WRITE CODE BELOW: % Step 1: Plot the function x*e^x-cos(x) on the interval [-2,2] % Step 2: Plot the horizontal line y=0 in the same window. % Step 3: Lastly, in the same window, plot the two points where % x*e^x-cos(x) crosses the x-axis with the color redStep by Step Solution
There are 3 Steps involved in it
Step: 1

Get Instant Access to Expert-Tailored Solutions
See step-by-step solutions with expert insights and AI powered tools for academic success
Step: 2

Step: 3
Ace Your Homework with AI
Get the answers you need in no time with our AI-driven, step-by-step assistance
Get Started
DB2 9 For Linux UNIX And Windows Advanced Database Administration Certification Certification Study Guide
Authors: Roger E. Sanders, Dwaine R Snow
1st Edition
1583470808, 978-1583470800