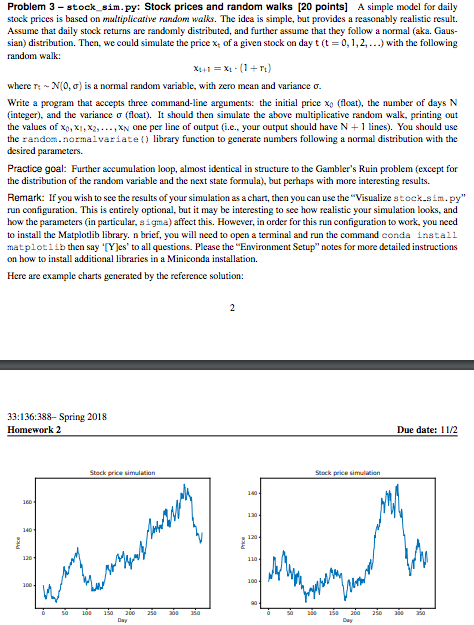
Problem 3- stock sim.py: Stock prices and random walks [20 points] A simple model for daily stock prices is based on multiplicative random walks. The idea is simple, but provides a reasonably realistic result. Assume that daily stock returns are randomly distributed, and further assume that they follow a normal (aka. Gaus- sian) distribution. Then, we could simulate the pricext of a given stock on day t (t = 0, 1, 2, ) with the following random walk where Ts-N(0, ) is a normal random variable, with Zero mean and variance . Write a peogram that accepts three command-line arguments: the initial price x (loat), the number of days N (integer), and the variance (float). It should then simulate the above multiplicative random walk, printing out the values of 0, XI, X2, , XN One per line of output (ie.. your output should have N +1 lines). You should use the random.normalvariate library function to generate numbers following a normal distribution with the desired parameters. Practice goal: Further accumulation loop, almost identical in structure to the Gambler's Ruin problem (except for the distribution of the random variable and the next state formula), but perhaps with more interesting results. Remark: If you wish to see the results of your simulation as a chart, then you can use the "Visualize stock.sim.py" run configuration. This is entirely optional, but it may be interesting to see how realistic your simulation looks, and how the parameters (in particular, sigma) affect this. However, in order for this run configuration to work, you need to install the Matplotlib library. n brief, you will need to open a terminal and run the command conda install matplot1ib then say Yles' to all questions. Please the "Environment Setup" notes for more detailed instructions on how to install additiona libraries in a Miniconda installation. Here are example charts generated by the reference solution: 33:136:388- Spring 2018 Homework 2 Due date: 11/2 toc k price simulation Problem 3- stock sim.py: Stock prices and random walks [20 points] A simple model for daily stock prices is based on multiplicative random walks. The idea is simple, but provides a reasonably realistic result. Assume that daily stock returns are randomly distributed, and further assume that they follow a normal (aka. Gaus- sian) distribution. Then, we could simulate the pricext of a given stock on day t (t = 0, 1, 2, ) with the following random walk where Ts-N(0, ) is a normal random variable, with Zero mean and variance . Write a peogram that accepts three command-line arguments: the initial price x (loat), the number of days N (integer), and the variance (float). It should then simulate the above multiplicative random walk, printing out the values of 0, XI, X2, , XN One per line of output (ie.. your output should have N +1 lines). You should use the random.normalvariate library function to generate numbers following a normal distribution with the desired parameters. Practice goal: Further accumulation loop, almost identical in structure to the Gambler's Ruin problem (except for the distribution of the random variable and the next state formula), but perhaps with more interesting results. Remark: If you wish to see the results of your simulation as a chart, then you can use the "Visualize stock.sim.py" run configuration. This is entirely optional, but it may be interesting to see how realistic your simulation looks, and how the parameters (in particular, sigma) affect this. However, in order for this run configuration to work, you need to install the Matplotlib library. n brief, you will need to open a terminal and run the command conda install matplot1ib then say Yles' to all questions. Please the "Environment Setup" notes for more detailed instructions on how to install additiona libraries in a Miniconda installation. Here are example charts generated by the reference solution: 33:136:388- Spring 2018 Homework 2 Due date: 11/2 toc k price simulation


