

Answered step by step
Verified Expert Solution
Question
1 Approved Answer
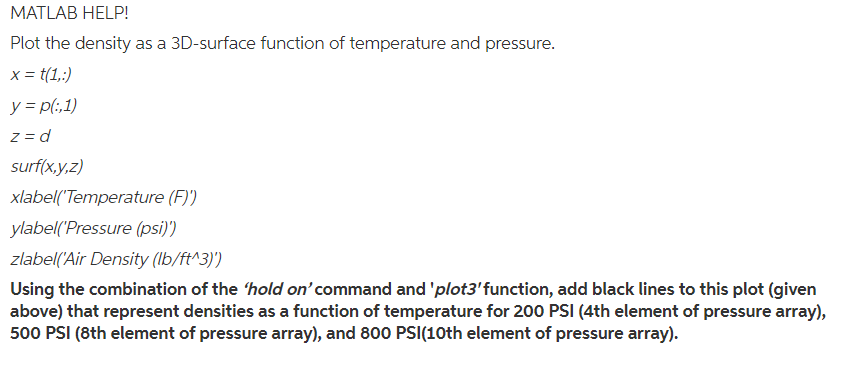
MATLAB HELP! Plot the density as a 3D-surface function of temperature and pressure. yp6.1 surfixy,z) xlabel( Temperature (F)) ylabel(Pressure (ps)) zlabel(Air Density (Ib/ft'3)) Using the
Step by Step Solution
There are 3 Steps involved in it
Step: 1

Get Instant Access to Expert-Tailored Solutions
See step-by-step solutions with expert insights and AI powered tools for academic success
Step: 2

Step: 3
Ace Your Homework with AI
Get the answers you need in no time with our AI-driven, step-by-step assistance
Get Started
Lnai 12458 Machine Learning And Knowledge Discovery In Databases European Conference Ecml Pkdd 2020 Ghent Belgium September 14 18 2020 Proceedings Part 2 Lnai 12458
Authors: Frank Hutter ,Kristian Kersting ,Jefrey Lijffijt ,Isabel Valera
1st Edition
3030676609, 978-3030676605