Answered step by step
Verified Expert Solution
Link Copied!

Question

1 Approved Answer

Matlab. Just need help filling in the blanks Close Courses Documentation Plot a bar graph of the dates (1 to 31) of Easter during the
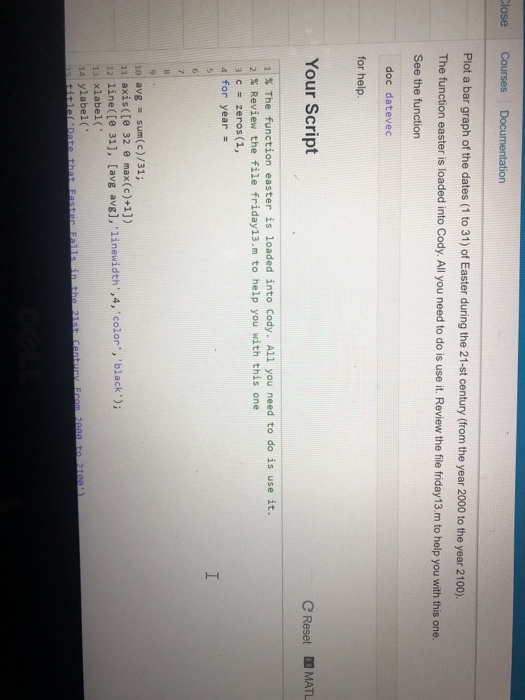
image text in transcribed
Matlab. Just need help filling in the blanks
Close Courses Documentation Plot a bar graph of the dates (1 to 31) of Easter during the 21-st century (from the year 2000 to the year 2100). The function easter is loaded into Cody. All you need to do is use it. Review the file friday13.m to help you with this one. See the function doc datevec for help. Your Script C Reset BMATL 11% The function easter is loaded into Cody. All you need to do is use it. 21% Review the file friday!3.m to help you with this one | 31 c zeros (1, for year e avg - sum(c)/31; 11 axis(Ie 32 e max(c)+1]) 12 line(Ie 31], [avg avg], 'linewidth' ,4, color', 'black); 13 xlabel(" 14 ylabel(

Step by Step Solution

There are 3 Steps involved in it

Step: 1

blur-text-image

Get Instant Access to Expert-Tailored Solutions

See step-by-step solutions with expert insights and AI powered tools for academic success

Step: 2

blur-text-image

Step: 3

blur-text-image

Ace Your Homework with AI

Get the answers you need in no time with our AI-driven, step-by-step assistance

Get Started

Recommended Textbook for

Learn Mysql The Easy Way A Beginner Friendly Guide

Authors: Kiet Huynh

1st Edition

B0CNY7143T, 979-8869761545

More Books

Students also viewed these Databases questions