matlab lab

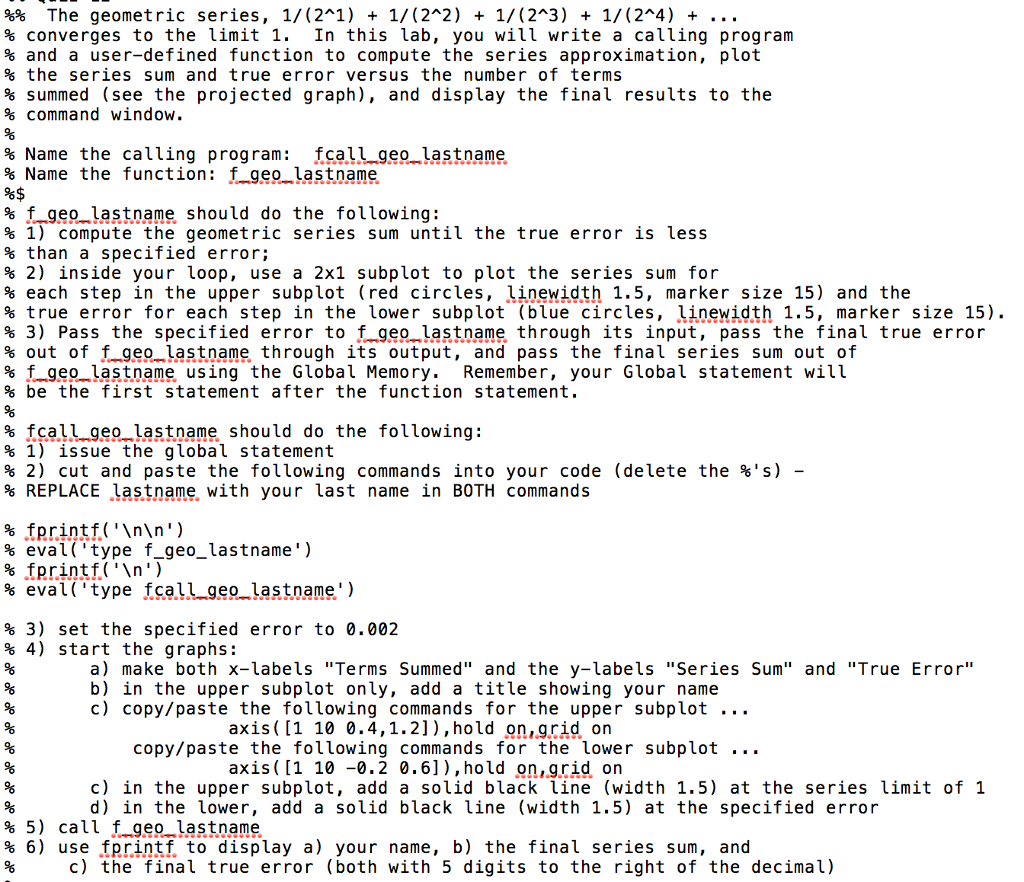
The geometric series, 1/(2^1) 1/(2^2) 1/(2^3) 1/(2^4) + ... converges to the limit 1. In this lab, you will write a calling program and a user-defined function to compute the series approximation, plot the series sum and true error versus the number of terms summed (see the projected graph), and display the final results to the command window. Name the calling program: fcall_geo_lastname Name the function: f_geo_lastname f_geo_last name should do the following: 1) compute the geometric series sum until the true error is less than a specified error; 2) inside your loop, use a 2 times 1 subplot to plot the series sum for each step in the upper subplot (red circles, linewidth 1.5, marker size 15) and the true error for each step in the lower subplot blue circles, linewidth 1.5, marker size 15) 3) Pass the specified error to f_geo_lastname through its input, pass the final true error out of f_geo_lastname through its output, and pass the final series sum out of f_geo_lastname using the Global Memory Remember, your Global statement will be the first statement after the function statement. fcall_geo_lastname should do the following: 1) issue the global statement 2) cut and paste the following commands into your code (delete the %'s) REPLACE lastname with your last name in BOTH commands fprintf (' ') eval ('type f_geo_lastname') fprintf (' \) eval ('type fcall_ geo_lastname') 3) Set the specified error to 0.002 4) start the graphs: a) make both x-labels "Terms Summed" and the y-labels "Series Sum" and "True Error" b) in the upper subplot only, add a title showing your name c) Copy/paste the following commands for the upper subplot ... axis [1 10 0.4, 1.2]) hold on, grid on copy/paste the following commands for the lower subplot ... axis [1 10 -0.2 0.6]), hold on, grid on c) in the upper subplot, add a solid black line (width 1.5) at the series limit of 1 d) in the lower add a solid black line (width 1.5) at the specified error 5) call f_geo_lastname 6) use fprintf to display a your name, b) the final series sum and c) the final true error (both with 5 digits to the right of the decimal) The geometric series, 1/(2^1) 1/(2^2) 1/(2^3) 1/(2^4) + ... converges to the limit 1. In this lab, you will write a calling program and a user-defined function to compute the series approximation, plot the series sum and true error versus the number of terms summed (see the projected graph), and display the final results to the command window. Name the calling program: fcall_geo_lastname Name the function: f_geo_lastname f_geo_last name should do the following: 1) compute the geometric series sum until the true error is less than a specified error; 2) inside your loop, use a 2 times 1 subplot to plot the series sum for each step in the upper subplot (red circles, linewidth 1.5, marker size 15) and the true error for each step in the lower subplot blue circles, linewidth 1.5, marker size 15) 3) Pass the specified error to f_geo_lastname through its input, pass the final true error out of f_geo_lastname through its output, and pass the final series sum out of f_geo_lastname using the Global Memory Remember, your Global statement will be the first statement after the function statement. fcall_geo_lastname should do the following: 1) issue the global statement 2) cut and paste the following commands into your code (delete the %'s) REPLACE lastname with your last name in BOTH commands fprintf (' ') eval ('type f_geo_lastname') fprintf (' \) eval ('type fcall_ geo_lastname') 3) Set the specified error to 0.002 4) start the graphs: a) make both x-labels "Terms Summed" and the y-labels "Series Sum" and "True Error" b) in the upper subplot only, add a title showing your name c) Copy/paste the following commands for the upper subplot ... axis [1 10 0.4, 1.2]) hold on, grid on copy/paste the following commands for the lower subplot ... axis [1 10 -0.2 0.6]), hold on, grid on c) in the upper subplot, add a solid black line (width 1.5) at the series limit of 1 d) in the lower add a solid black line (width 1.5) at the specified error 5) call f_geo_lastname 6) use fprintf to display a your name, b) the final series sum and c) the final true error (both with 5 digits to the right of the decimal)


