 MATLAB ONLY MATLAB ONLY NO FPRINT NO WHILE ONLY FOR AND IFMATLAB ONLY MATLAB ONLY NO FPRINT NO WHILE ONLY FOR AND IFMATLAB ONLY MATLAB ONLY NO FPRINT NO WHILE ONLY FOR AND IFMATLAB ONLY MATLAB ONLY NO FPRINT NO WHILE ONLY FOR AND IFMATLAB ONLY MATLAB ONLY NO FPRINT NO WHILE ONLY FOR AND IFMATLAB ONLY MATLAB ONLY NO FPRINT NO WHILE ONLY FOR AND IF

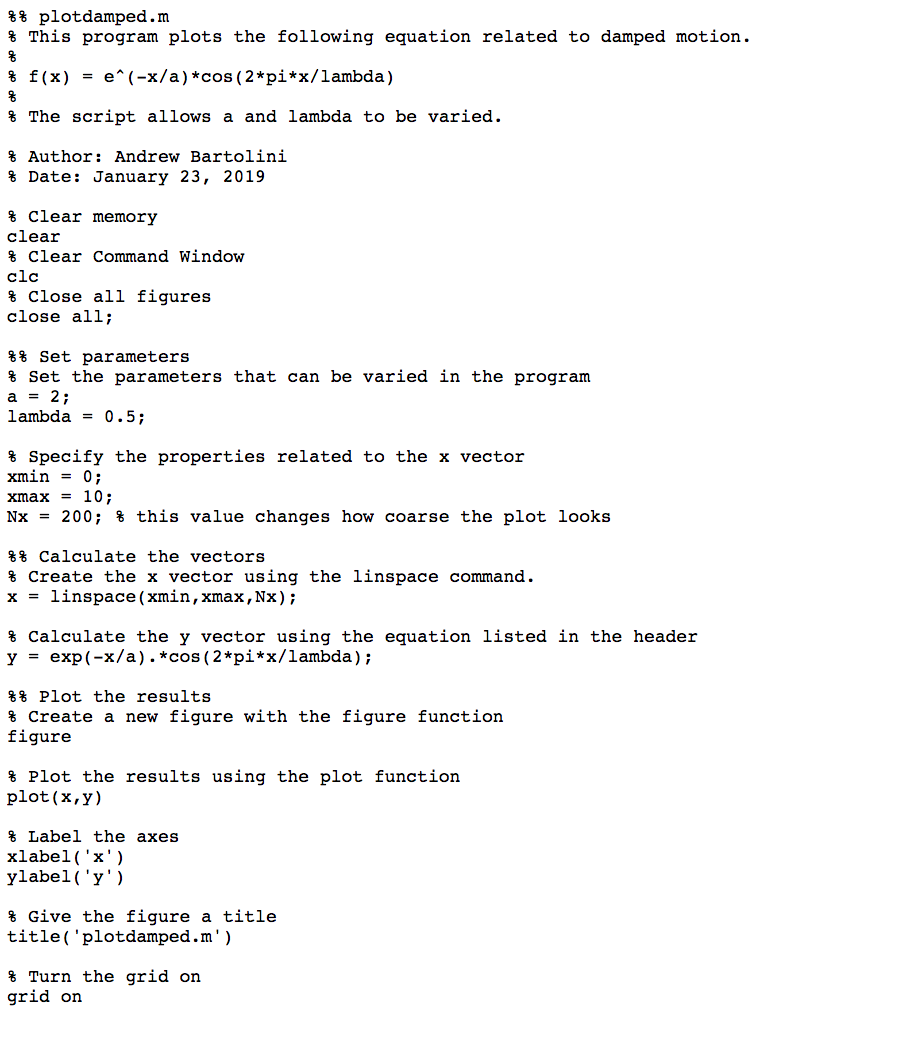
$ % plotdamped.m $ This program plots the following equation related to damped motion. f(x) = e^(-x/a) *cos(2*pi*x/lambda) % The script allows a and lambda to be varied. % Author: Andrew Bartolini $ Date: January 23, 2019 % clear memory clear % Clear Command Window clc $ close all figures close all; $% Set parameters % Set the parameters that can be varied in the program a = 2; lambda = 0.5; % Specify the properties related to the x vector xmin = 0; xmax = 10; Nx = 200; % this value changes how coarse the plot looks %% Calculate the vectors % Create the x vector using the linspace command. x = linspace(xmin, xmax, Nx); % Calculate the y vector using the equation listed in the header y = exp(-x/a). *cos(2*pi*x/lambda); %% Plot the results % Create a new figure with the figure function figure Plot the results using the plot function plot(x,y) % Label the axes xlabel('x') ylabel('y') & Give the figure a title title('plotdamped.m') $ Turn the grid on grid on 5. Animating Damped Motion // Filename: animatedamped.m Start with the plotdamped.m code that you completed for Homework 2. Change the code so there is a variable doAnimate that is set at the beginning of the code and is either true or false. If do Animate is false, the program should create a plot of the curve with no animation. If doAnimate is true, the plot must now be animated, showing the current point as a red circle and the previous points as a blue line (similar to the sine wave in the animation videos). Failure to use these line styles, markers and colors will result in you losing points. $ % plotdamped.m $ This program plots the following equation related to damped motion. f(x) = e^(-x/a) *cos(2*pi*x/lambda) % The script allows a and lambda to be varied. % Author: Andrew Bartolini $ Date: January 23, 2019 % clear memory clear % Clear Command Window clc $ close all figures close all; $% Set parameters % Set the parameters that can be varied in the program a = 2; lambda = 0.5; % Specify the properties related to the x vector xmin = 0; xmax = 10; Nx = 200; % this value changes how coarse the plot looks %% Calculate the vectors % Create the x vector using the linspace command. x = linspace(xmin, xmax, Nx); % Calculate the y vector using the equation listed in the header y = exp(-x/a). *cos(2*pi*x/lambda); %% Plot the results % Create a new figure with the figure function figure Plot the results using the plot function plot(x,y) % Label the axes xlabel('x') ylabel('y') & Give the figure a title title('plotdamped.m') $ Turn the grid on grid on 5. Animating Damped Motion // Filename: animatedamped.m Start with the plotdamped.m code that you completed for Homework 2. Change the code so there is a variable doAnimate that is set at the beginning of the code and is either true or false. If do Animate is false, the program should create a plot of the curve with no animation. If doAnimate is true, the plot must now be animated, showing the current point as a red circle and the previous points as a blue line (similar to the sine wave in the animation videos). Failure to use these line styles, markers and colors will result in you losing points