

Question
Matlab plotting question load data from file named test_data(1).txt The file contains 4 columns of data: altitude, temperature, pressure, and density. Load this data into
Matlab plotting question
load data from file named test_data(1).txt
The file contains 4 columns of data: altitude, temperature, pressure, and density.
Load this data into matlab and then generate a plot of
altitude vs. temperature
altitude vs. pressure
altitude vs. density
Be sure to add axis labels and titles to the plots.
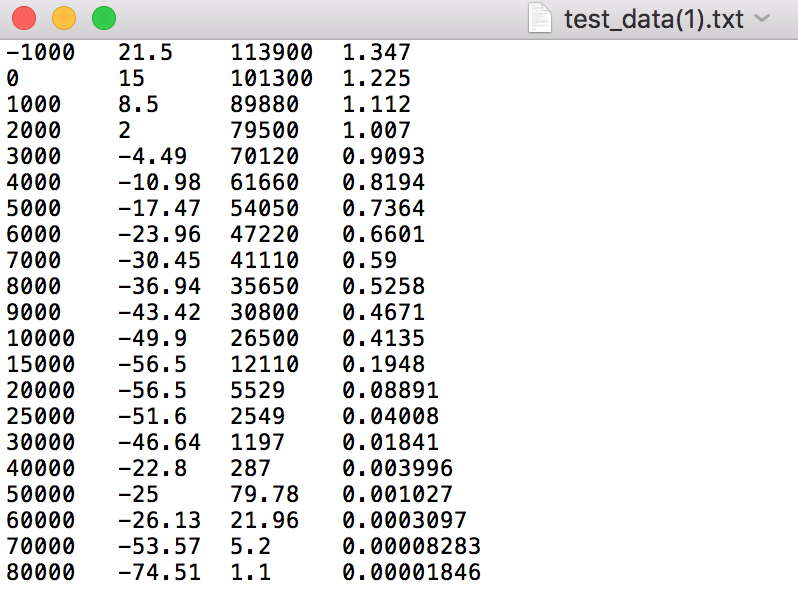
1000 21.5 113900 1.347 15 101300 1.225 1000 8.5 89880 1.112 2000 2 79500 1.007 3000 4.49 70120 0.9093 4000 10.98 61660 0.8194 5000 17.47 54050 0.7364 6000 23.96 47220 0.6601 7000 30. 45 41 110 0.59 8000 36.94 35650 0.5258 9000 43.42 30800 0.4671 10000 49.9 26500 0.4135 15000 56.5 12110 0.1948 20000 56.5 5529 0.08891 25000 51.6 2549 04008 30000 46.64 1197 0.01841 0.003996 40000 -22.8 287 50000 25 79.78 0.001027 60000 26.13 21.96 0.0003097 70000 53.57 5.2 0.00008283 80000 74.51 1.1 0.00001846 test data (1).txt
Step by Step Solution
There are 3 Steps involved in it
Step: 1

Get Instant Access to Expert-Tailored Solutions
See step-by-step solutions with expert insights and AI powered tools for academic success
Step: 2

Step: 3
Ace Your Homework with AI
Get the answers you need in no time with our AI-driven, step-by-step assistance
Get Started
SQL Antipatterns Avoiding The Pitfalls Of Database Programming
Authors: Bill Karwin
1st Edition
1680508989, 978-1680508987