Answered step by step
Verified Expert Solution
Link Copied!

Question

1 Approved Answer

Matlab problem %% The geometric series, 1/(2^1) + 1/(2^2) + l/(2^3) + 1/(2^4) + ... % converges to the limit 1. In this lab, you

Matlab problem image text in transcribed
%% The geometric series, 1/(2^1) + 1/(2^2) + l/(2^3) + 1/(2^4) + ... % converges to the limit 1. In this lab, you will write a calling program % and a user-defined function to compute the series approximation, plot % the series sum and true error versus the number of terms % summed (see the projected graph), and display the final results to the % command window. % % Name the calling program: call, geo. lastname % Name the function: f..geo. lastname %$ % f_geo_lastname should do the following: % 1) compute the geometric series sum until the true error is less % than a specified error; % 2) inside your loop, use a 2x1 subplot to plot the series sum for % each step in the upper subplot (red circles, line width 1.5, marker size 15) and the % true error for each step in the lower subplot (blue circles, .line width 1.5, marker size 15). % 3) Pass the specified error to f_geo_lastmane through its input, pass the final true error % out of f_geo_lastname through its output, and pass the final series sum out of f_geo_lastname using the Global Memory. Remember, your Global statement will % be the first statement after the function statement. % % f call geo.lastname should do the following: % 1) issue the global statement % 2) cut and paste the following commands into your code (delete the %'s) -% REPLACE lastname with your last name in BOTH commands * f printf (' ' ') % eval(type f_geo_lastname') * f print f% eval('type f call geo lastname') % 3) set the specified error to 0.002 % 4) start the graphs: % a) make both x-labels "Terms Summed" and the y-labels "Series Sum" and "True Error" % b) in the upper subplot only, add a title showing your name % c) copy/paste the following commands for the upper subplot ... % axis([l 10 0.4, 1.21), hold on, .grid. on % copy/paste the following commands for the lower subplot ... % axis([l 10 -0.2 0.6]), hold on, .grid. on % c) in the upper subplot, add a solid black line (width 1.5) at the series limit of 1 % d) in the lower, add a solid black line (width 1.5) at the specified error % 5) call f, geo, lastname % 6) use f print f. to display a) your name, b) the final series sum, and % c) the final true error (both with 5 digits to the right of the decimal)

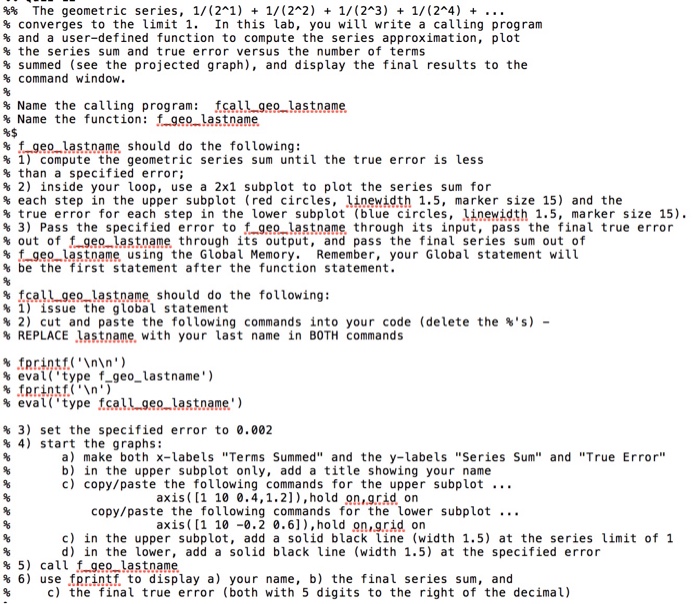
Step by Step Solution

There are 3 Steps involved in it

Step: 1

blur-text-image

Get Instant Access to Expert-Tailored Solutions

See step-by-step solutions with expert insights and AI powered tools for academic success

Step: 2

blur-text-image

Step: 3

blur-text-image

Ace Your Homework with AI

Get the answers you need in no time with our AI-driven, step-by-step assistance

Get Started

Recommended Textbook for

Database Reliability Engineering Designing And Operating Resilient Database Systems

Authors: Laine Campbell, Charity Majors

1st Edition

978-1491925942

More Books

Students also viewed these Databases questions

Question

Explain the function and purpose of the Job Level Table.

Answered: 1 week ago