

Answered step by step
Verified Expert Solution
Question
1 Approved Answer
matlab programming The above table gives the simple parameters of 10 different Fe-based metals that have been alloyed with Mg at different Mg composition. The
matlab programming
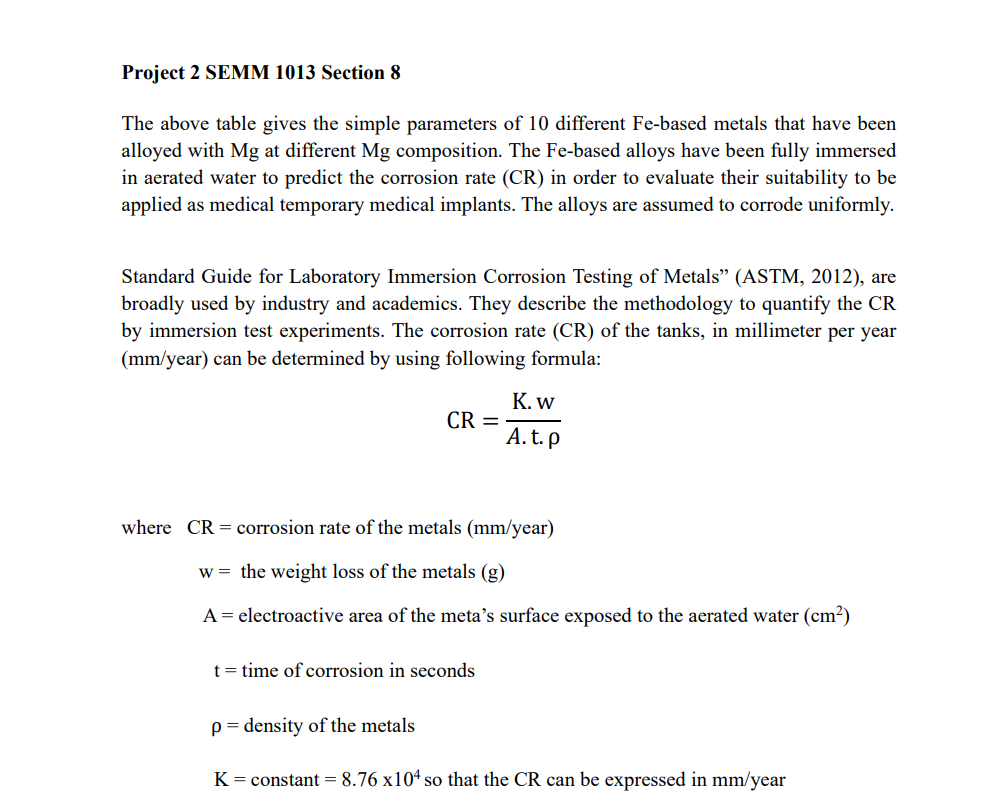
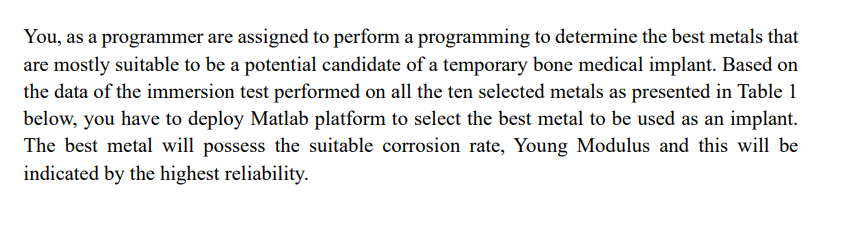
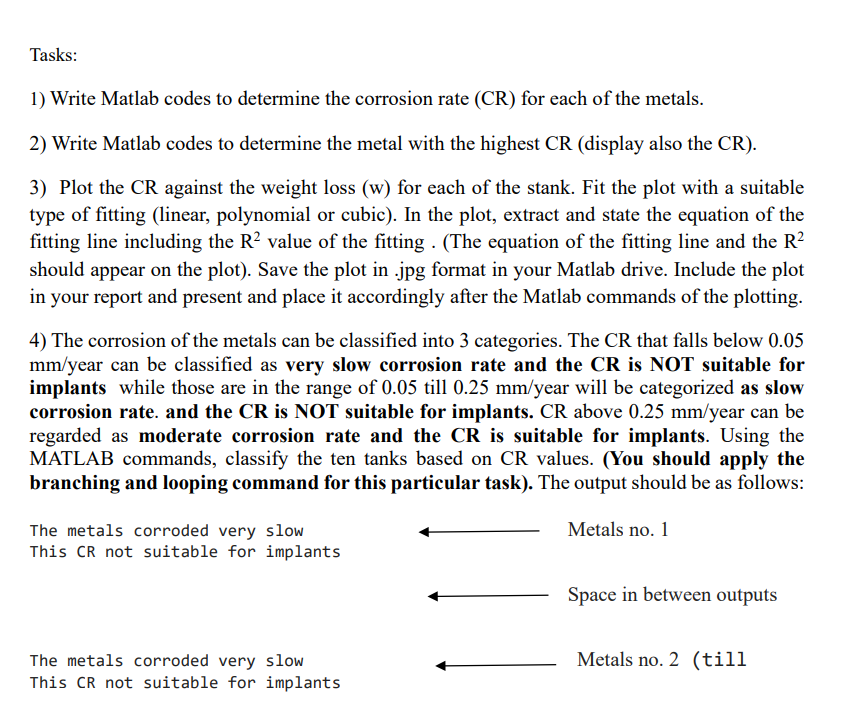
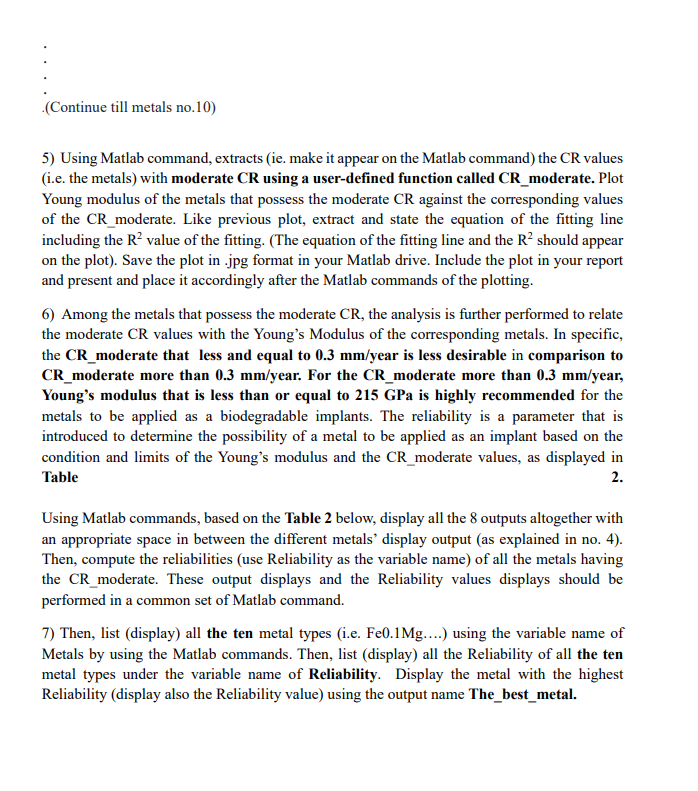
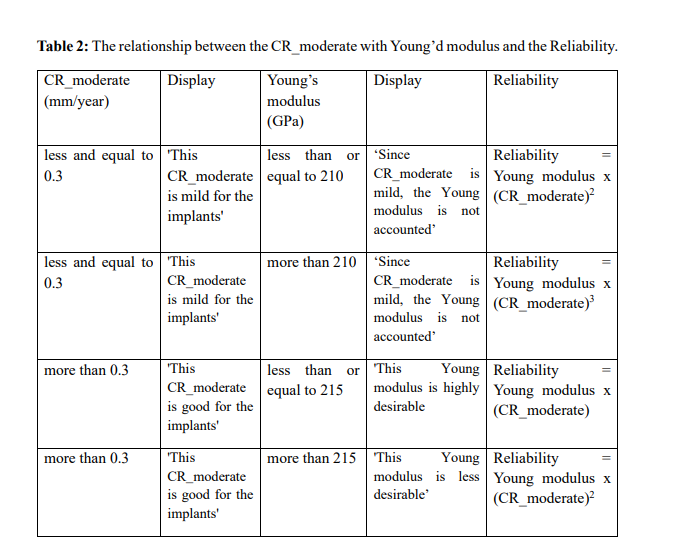
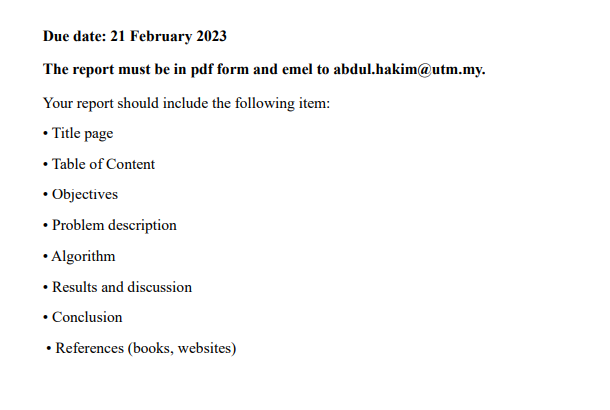
The above table gives the simple parameters of 10 different Fe-based metals that have been alloyed with Mg at different Mg composition. The Fe-based alloys have been fully immersed in aerated water to predict the corrosion rate (CR) in order to evaluate their suitability to be applied as medical temporary medical implants. The alloys are assumed to corrode uniformly. Standard Guide for Laboratory Immersion Corrosion Testing of Metals" (ASTM, 2012), are broadly used by industry and academics. They describe the methodology to quantify the CR by immersion test experiments. The corrosion rate (CR) of the tanks, in millimeter per year (mm/year) can be determined by using following formula: CR=A.t.K.W where CR= corrosion rate of the metals (mm/ year) w= the weight loss of the metals (g) A= electroactive area of the meta's surface exposed to the aerated water (cm2) t= time of corrosion in seconds = density of the metals K= constant =8.76104 so that the CR can be expressed in mm/ year You, as a programmer are assigned to perform a programming to determine the best metals that are mostly suitable to be a potential candidate of a temporary bone medical implant. Based on the data of the immersion test performed on all the ten selected metals as presented in Table 1 below, you have to deploy Matlab platform to select the best metal to be used as an implant. The best metal will possess the suitable corrosion rate, Young Modulus and this will be indicated by the highest reliability. 3) Plot the CR against the weight loss (w) for each of the stank. Fit the plot with a suitable type of fitting (linear, polynomial or cubic). In the plot, extract and state the equation of the fitting line including the R2 value of the fitting . (The equation of the fitting line and the R2 should appear on the plot). Save the plot in .jpg format in your Matlab drive. Include the plot in your report and present and place it accordingly after the Matlab commands of the plotting. 4) The corrosion of the metals can be classified into 3 categories. The CR that falls below 0.05 mm/ year can be classified as very slow corrosion rate and the CR is NOT suitable for implants while those are in the range of 0.05 till 0.25mm/year will be categorized as slow corrosion rate. and the CR is NOT suitable for implants. CR above 0.25mm/ year can be regarded as moderate corrosion rate and the CR is suitable for implants. Using the MATLAB commands, classify the ten tanks based on CR values. (You should apply the branching and looping command for this particular task). The output should be as follows: The metals corroded very slow This CR not suitable for implants Space in between outputs The metals corroded very slow This CR not suitable for implants Metals no. 2 (till (Continue till metals no.10) 5) Using Matlab command, extracts (ie. make it appear on the Matlab command) the CR values (i.e. the metals) with moderate CR using a user-defined function called CR_moderate. Plot Young modulus of the metals that possess the moderate CR against the corresponding values of the CR_moderate. Like previous plot, extract and state the equation of the fitting line including the R2 value of the fitting. (The equation of the fitting line and the R2 should appear on the plot). Save the plot in .jpg format in your Matlab drive. Include the plot in your report and present and place it accordingly after the Matlab commands of the plotting. 6) Among the metals that possess the moderate CR, the analysis is further performed to relate the moderate CR values with the Young's Modulus of the corresponding metals. In specific, the CR_moderate that less and equal to 0.3mm/ year is less desirable in comparison to CR_moderate more than 0.3mm/ year. For the CR_moderate more than 0.3mm/ year, Young's modulus that is less than or equal to 215GPa is highly recommended for the metals to be applied as a biodegradable implants. The reliability is a parameter that is introduced to determine the possibility of a metal to be applied as an implant based on the condition and limits of the Young's modulus and the CR moderate values, as displayed in Table 2. Using Matlab commands, based on the Table 2 below, display all the 8 outputs altogether with an appropriate space in between the different metals' display output (as explained in no. 4). Then, compute the reliabilities (use Reliability as the variable name) of all the metals having the CR moderate. These output displays and the Reliability values displays should be performed in a common set of Matlab command. 7) Then, list (display) all the ten metal types (i.e. Fe0.1Mg....) using the variable name of Metals by using the Matlab commands. Then, list (display) all the Reliability of all the ten metal types under the variable name of Reliability. Display the metal with the highest Reliability (display also the Reliability value) using the output name The_best_metal. Table 2: The relationship between the CR_moderate with Young'd modulus and the Reliability. Due date: 21 February 2023 The report must be in pdf form and emel to abdul.hakim@utm.my. Your report should include the following item: - Title page - Table of Content - Objectives - Problem description - Algorithm - Results and discussion - Conclusion - References (books, websites) The above table gives the simple parameters of 10 different Fe-based metals that have been alloyed with Mg at different Mg composition. The Fe-based alloys have been fully immersed in aerated water to predict the corrosion rate (CR) in order to evaluate their suitability to be applied as medical temporary medical implants. The alloys are assumed to corrode uniformly. Standard Guide for Laboratory Immersion Corrosion Testing of Metals" (ASTM, 2012), are broadly used by industry and academics. They describe the methodology to quantify the CR by immersion test experiments. The corrosion rate (CR) of the tanks, in millimeter per year (mm/year) can be determined by using following formula: CR=A.t.K.W where CR= corrosion rate of the metals (mm/ year) w= the weight loss of the metals (g) A= electroactive area of the meta's surface exposed to the aerated water (cm2) t= time of corrosion in seconds = density of the metals K= constant =8.76104 so that the CR can be expressed in mm/ year You, as a programmer are assigned to perform a programming to determine the best metals that are mostly suitable to be a potential candidate of a temporary bone medical implant. Based on the data of the immersion test performed on all the ten selected metals as presented in Table 1 below, you have to deploy Matlab platform to select the best metal to be used as an implant. The best metal will possess the suitable corrosion rate, Young Modulus and this will be indicated by the highest reliability. 3) Plot the CR against the weight loss (w) for each of the stank. Fit the plot with a suitable type of fitting (linear, polynomial or cubic). In the plot, extract and state the equation of the fitting line including the R2 value of the fitting . (The equation of the fitting line and the R2 should appear on the plot). Save the plot in .jpg format in your Matlab drive. Include the plot in your report and present and place it accordingly after the Matlab commands of the plotting. 4) The corrosion of the metals can be classified into 3 categories. The CR that falls below 0.05 mm/ year can be classified as very slow corrosion rate and the CR is NOT suitable for implants while those are in the range of 0.05 till 0.25mm/year will be categorized as slow corrosion rate. and the CR is NOT suitable for implants. CR above 0.25mm/ year can be regarded as moderate corrosion rate and the CR is suitable for implants. Using the MATLAB commands, classify the ten tanks based on CR values. (You should apply the branching and looping command for this particular task). The output should be as follows: The metals corroded very slow This CR not suitable for implants Space in between outputs The metals corroded very slow This CR not suitable for implants Metals no. 2 (till (Continue till metals no.10) 5) Using Matlab command, extracts (ie. make it appear on the Matlab command) the CR values (i.e. the metals) with moderate CR using a user-defined function called CR_moderate. Plot Young modulus of the metals that possess the moderate CR against the corresponding values of the CR_moderate. Like previous plot, extract and state the equation of the fitting line including the R2 value of the fitting. (The equation of the fitting line and the R2 should appear on the plot). Save the plot in .jpg format in your Matlab drive. Include the plot in your report and present and place it accordingly after the Matlab commands of the plotting. 6) Among the metals that possess the moderate CR, the analysis is further performed to relate the moderate CR values with the Young's Modulus of the corresponding metals. In specific, the CR_moderate that less and equal to 0.3mm/ year is less desirable in comparison to CR_moderate more than 0.3mm/ year. For the CR_moderate more than 0.3mm/ year, Young's modulus that is less than or equal to 215GPa is highly recommended for the metals to be applied as a biodegradable implants. The reliability is a parameter that is introduced to determine the possibility of a metal to be applied as an implant based on the condition and limits of the Young's modulus and the CR moderate values, as displayed in Table 2. Using Matlab commands, based on the Table 2 below, display all the 8 outputs altogether with an appropriate space in between the different metals' display output (as explained in no. 4). Then, compute the reliabilities (use Reliability as the variable name) of all the metals having the CR moderate. These output displays and the Reliability values displays should be performed in a common set of Matlab command. 7) Then, list (display) all the ten metal types (i.e. Fe0.1Mg....) using the variable name of Metals by using the Matlab commands. Then, list (display) all the Reliability of all the ten metal types under the variable name of Reliability. Display the metal with the highest Reliability (display also the Reliability value) using the output name The_best_metal. Table 2: The relationship between the CR_moderate with Young'd modulus and the Reliability. Due date: 21 February 2023 The report must be in pdf form and emel to abdul.hakim@utm.my. Your report should include the following item: - Title page - Table of Content - Objectives - Problem description - Algorithm - Results and discussion - Conclusion - References (books, websites)
Step by Step Solution
There are 3 Steps involved in it
Step: 1

Get Instant Access to Expert-Tailored Solutions
See step-by-step solutions with expert insights and AI powered tools for academic success
Step: 2

Step: 3
Ace Your Homework with AI
Get the answers you need in no time with our AI-driven, step-by-step assistance
Get Started
Advances In Databases 28th British National Conference On Databases Bncod 28 Manchester Uk July 2011 Revised Selected Papers Lncs 7051
Authors: Alvaro A.A. Fernandes ,Alasdair J.G. Gray ,Khalid Belhajjame
2011th Edition
3642245765, 978-3642245763