Answered step by step
Verified Expert Solution
Question
1 Approved Answer
MATLAB questions, need help with!! Will probably need to utilize the online version of MATLAB 1 Matrix Creation (6 points) Use colon notation to create
MATLAB questions, need help with!! 


Will probably need to utilize the online version of MATLAB
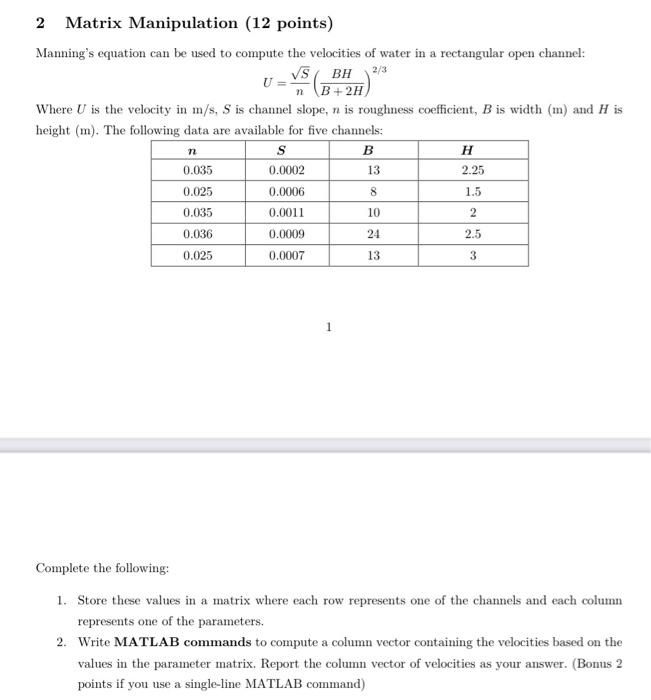
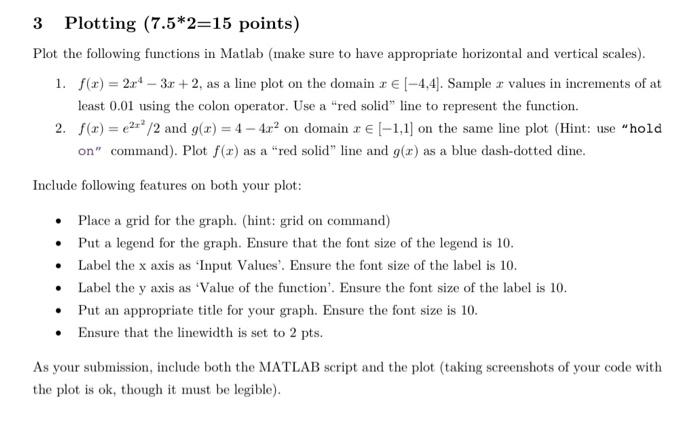
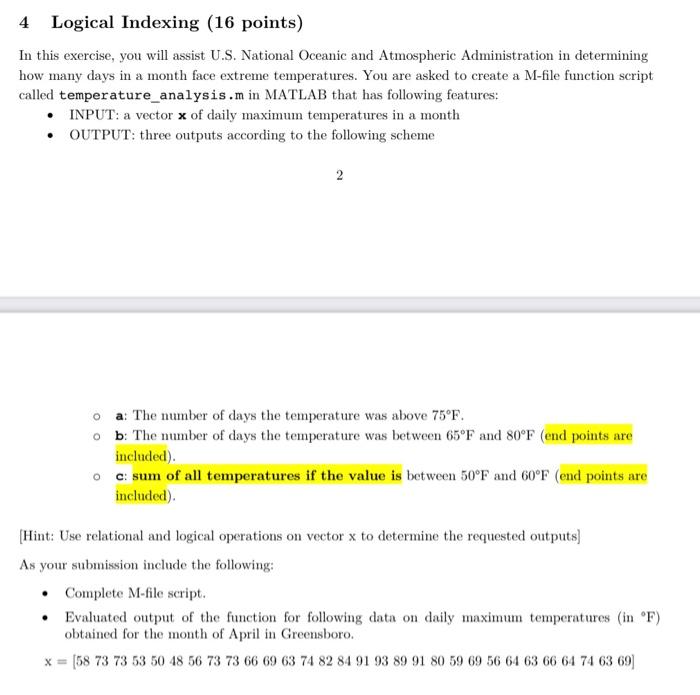
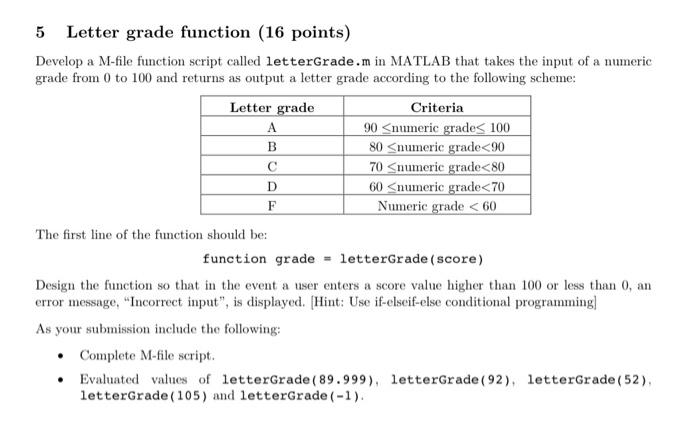
1 Matrix Creation (6 points) Use colon notation to create vectors identical to the following created using the linspace () function: 1. v=1 inspace (33,15,11) Then, use linspace ( ) to create vectors identical to the following created using the colon operator: 2. r=[6.5:0.75:10.5] 2 Matrix Manipulation (12 points) Manning's equation can be used to compute the velocities of water in a rectangular open channel: U=nS(B+2HBH)2/3 Where U is the velocity in m/s,S is channel slope, n is roughness coefficient, B is width (m) and H is height (m). The following data are available for five channels: Complete the following: 1. Store these values in a matrix where each row represents one of the channels and each column represents one of the parameters. 2. Write MATLAB commands to compute a column vector containing the velocities based on the values in the parameter matrix. Report the column vector of velocities as your answer. (Bonus 2 points if you use a single-line MATLAB command) 3 Plotting (7.52=15 points) Plot the following functions in Matlab (make sure to have appropriate horizontal and vertical scales). 1. f(x)=2x43x+2, as a line plot on the domain x[4,4]. Sample x values in increments of at least 0.01 using the colon operator. Use a "red solid" line to represent the function. 2. f(x)=e2x2/2 and g(x)=44x2 on domain x[1,1] on the same line plot (Hint: use "hold on" command). Plot f(x) as a "red solid" line and g(x) as a blue dash-dotted dine. Include following features on both your plot: - Place a grid for the graph. (hint: grid on command) - Put a legend for the graph. Ensure that the font size of the legend is 10. - Label the x axis as 'Input Values'. Ensure the font size of the label is 10. - Label the y axis as 'Value of the function'. Ensure the font size of the label is 10. - Put an appropriate title for your graph. Ensure the font size is 10. - Ensure that the linewidth is set to 2 pts. As your submission, include both the MATLAB script and the plot (taking screenshots of your code with the plot is ok, though it must be legible). 4 Logical Indexing (16 points) In this exercise, you will assist U.S. National Oceanic and Atmospheric Administration in determining how many days in a month face extreme temperatures. You are asked to create a M-file function script called temperature_analysis.m in MATLAB that has following features: - INPUT: a vector x of daily maximum temperatures in a month - OUTPUT: three outputs according to the following scheme 2 a: The number of days the temperature was above 75F. b: The number of days the temperature was between 65F and 80F (end points are included). c: sum of all temperatures if the value is between 50F and 60F (end points are included). [Hint: Use relational and logical operations on vector x to determine the requested outputs] As your submission include the following: - Complete M-file script. - Evaluated output of the function for following data on daily maximum temperatures (in F ) obtained for the month of April in Greensboro. x=[78735350485673736669637482849193899180596956646366647463] 5 Letter grade function (16 points) Develop a M-file function script called letterGrade.m in MATLAB that takes the input of a numeric grade from 0 to 100 and returns as output a letter grade according to the following scheme: The first line of the function should be: function grade = letterGrade (score) Design the function so that in the event a user enters a score value higher than 100 or less than 0 , an error message, "Incorrect input", is displayed. [Hint: Use if-elseif-else conditional programming] As your submission include the following: - Complete M-file script. - Evaluated values of lettergrade(89.999), letterGrade(92), letterGrade(52), letterGrade (105) and letterGrade (-1) Step by Step Solution
There are 3 Steps involved in it
Step: 1

Get Instant Access to Expert-Tailored Solutions
See step-by-step solutions with expert insights and AI powered tools for academic success
Step: 2

Step: 3

Ace Your Homework with AI
Get the answers you need in no time with our AI-driven, step-by-step assistance
Get Started


