

Answered step by step
Verified Expert Solution
Question
1 Approved Answer
matlab show code Problem Set 7 - Create a single M-file for each problem shown below: (Always suppress the echo for the vectors, label both
matlab show code 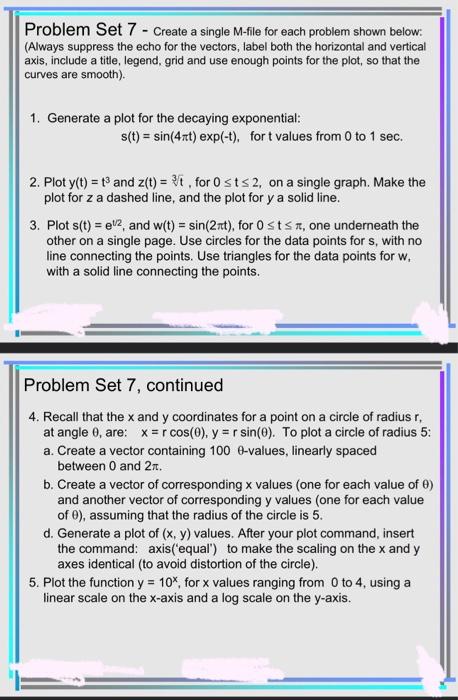
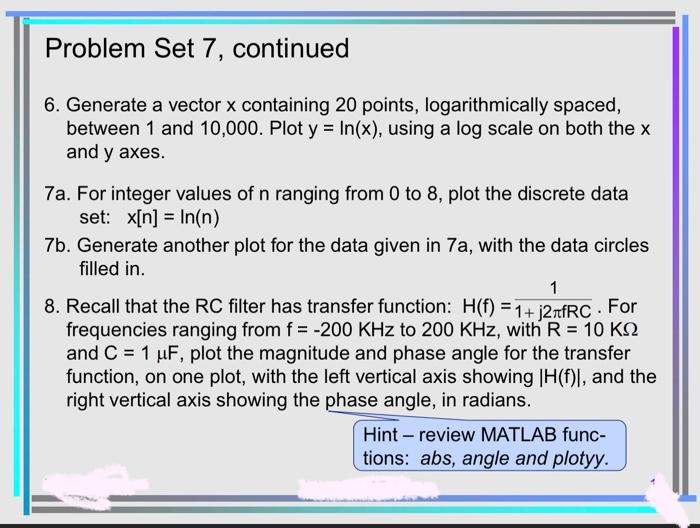
Problem Set 7 - Create a single M-file for each problem shown below: (Always suppress the echo for the vectors, label both the horizontal and vertical axis, include a title, legend, grid and use enough points for the plot, so that the curves are smooth). 1. Generate a plot for the decaying exponential: s(t)=sin(4t)exp(t), for t values from 0 to 1sec. 2. Plot y(t)=t3 and z(t)=3t, for 0t2, on a single graph. Make the plot for z a dashed line, and the plot for y a solid line. 3. Plot s(t)=e1/2, and w(t)=sin(2t), for 0t, one underneath the other on a single page. Use circles for the data points for s, with no line connecting the points. Use triangles for the data points for w, with a solid line connecting the points. Problem Set 7 , continued 4. Recall that the x and y coordinates for a point on a circle of radius r, at angle , are: x=rcos(),y=rsin(). To plot a circle of radius 5 : a. Create a vector containing 100 -values, linearly spaced between 0 and 2. b. Create a vector of corresponding x values (one for each value of ) and another vector of corresponding y values (one for each value of ), assuming that the radius of the circle is 5 . d. Generate a plot of (x,y) values. After your plot command, insert the command: axis('equal') to make the scaling on the x and y axes identical (to avoid distortion of the circle). 5. Plot the function y=10x, for x values ranging from 0 to 4 , using a linear scale on the x-axis and a log scale on the y-axis. Problem Set 7 , continued 6. Generate a vector x containing 20 points, logarithmically spaced, between 1 and 10,000. Plot y=ln(x), using a log scale on both the x and y axes. 7a. For integer values of n ranging from 0 to 8 , plot the discrete data set: x[n]=ln(n) 7b. Generate another plot for the data given in 7a, with the data circles filled in. 8. Recall that the RC filter has transfer function: H(f)=1+j2fRC1. For frequencies ranging from f=200KHz to 200KHz, with R=10K and C=1F, plot the magnitude and phase angle for the transfer function, on one plot, with the left vertical axis showing H(f), and the right vertical axis showing the phase angle, in radians Step by Step Solution
There are 3 Steps involved in it
Step: 1

Get Instant Access to Expert-Tailored Solutions
See step-by-step solutions with expert insights and AI powered tools for academic success
Step: 2

Step: 3
Ace Your Homework with AI
Get the answers you need in no time with our AI-driven, step-by-step assistance
Get Started
The Manga Guide To Databases
Authors: Mana Takahashi, Shoko Azuma, Co Ltd Trend
1st Edition
1593271905, 978-1593271909