Answered step by step
Verified Expert Solution
Link Copied!

Question

1 Approved Answer

MATLAB Users Fal Khan Documents Live Edo-cythers Fah Khan Downloads HW2_3.mk HW3 + Problem 5.31 Createx and y vectors from -5 10+5 with a spacing
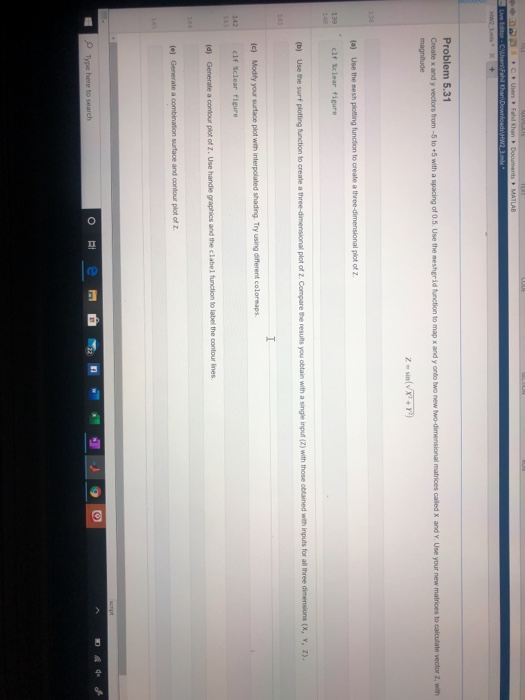
image text in transcribed
MATLAB Users Fal Khan Documents Live Edo-cythers Fah Khan Downloads HW2_3.mk HW3 + Problem 5.31 Createx and y vectors from -5 10+5 with a spacing of 0.5. Use the mesherid function to map x and y onto two new two-dimensional matrices called X and Y. Use your new matrices to calculate vector 2, with magnitude z sin(X+Y) Use the mesh plotting function to create a three-dimensional plot of 139 clf clear figure (b) Use the surf plotting function to create a three-dimensional plot of z. Compare the results you obtain with a single input (2) with those obtained with inputs for all three dimensions (X, Y, Z). c) Modify your surface plot with interpolated shading. Try using offerent color aps. clf Xclear figure (d) Generate a contour plot of z. Use handle graphics and the clabel function to label the contour lines (e) Generate a combination surface and colour plot of z Type here to search

Step by Step Solution

There are 3 Steps involved in it

Step: 1

blur-text-image

Get Instant Access to Expert-Tailored Solutions

See step-by-step solutions with expert insights and AI powered tools for academic success

Step: 2

blur-text-image

Step: 3

blur-text-image

Ace Your Homework with AI

Get the answers you need in no time with our AI-driven, step-by-step assistance

Get Started

Students also viewed these Databases questions

Question

=+1. Who are your competitors?

Answered: 1 week ago