

Answered step by step
Verified Expert Solution
Question
1 Approved Answer
matlab You are given the folowing (x,y) points data. (0.5, 0.5) (1.2,1.1) (2.8, 3.4) (3.7, 4.8) (5.2, 6.4) (6.8, 7.7) (7.5, 7.1) (9,6.8) Find a
matlab
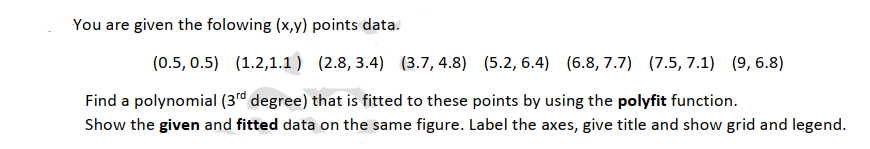
You are given the folowing (x,y) points data. (0.5, 0.5) (1.2,1.1) (2.8, 3.4) (3.7, 4.8) (5.2, 6.4) (6.8, 7.7) (7.5, 7.1) (9,6.8) Find a polynomial (3rd degree) that is fitted to these points by using the polyfit function. Show the given and fitted data on the same figure. Label the axes, give title and show grid and legendStep by Step Solution
There are 3 Steps involved in it
Step: 1

Get Instant Access to Expert-Tailored Solutions
See step-by-step solutions with expert insights and AI powered tools for academic success
Step: 2

Step: 3
Ace Your Homework with AI
Get the answers you need in no time with our AI-driven, step-by-step assistance
Get Started
Advances In Database Technology Edbt 94 4th International Conference On Extending Database Technology Cambridge United Kingdom March 1994 Proceedings Lncs 779
Authors: Matthias Jarke ,Janis Bubenko ,Keith Jeffery
1994th Edition
3540578188, 978-3540578185