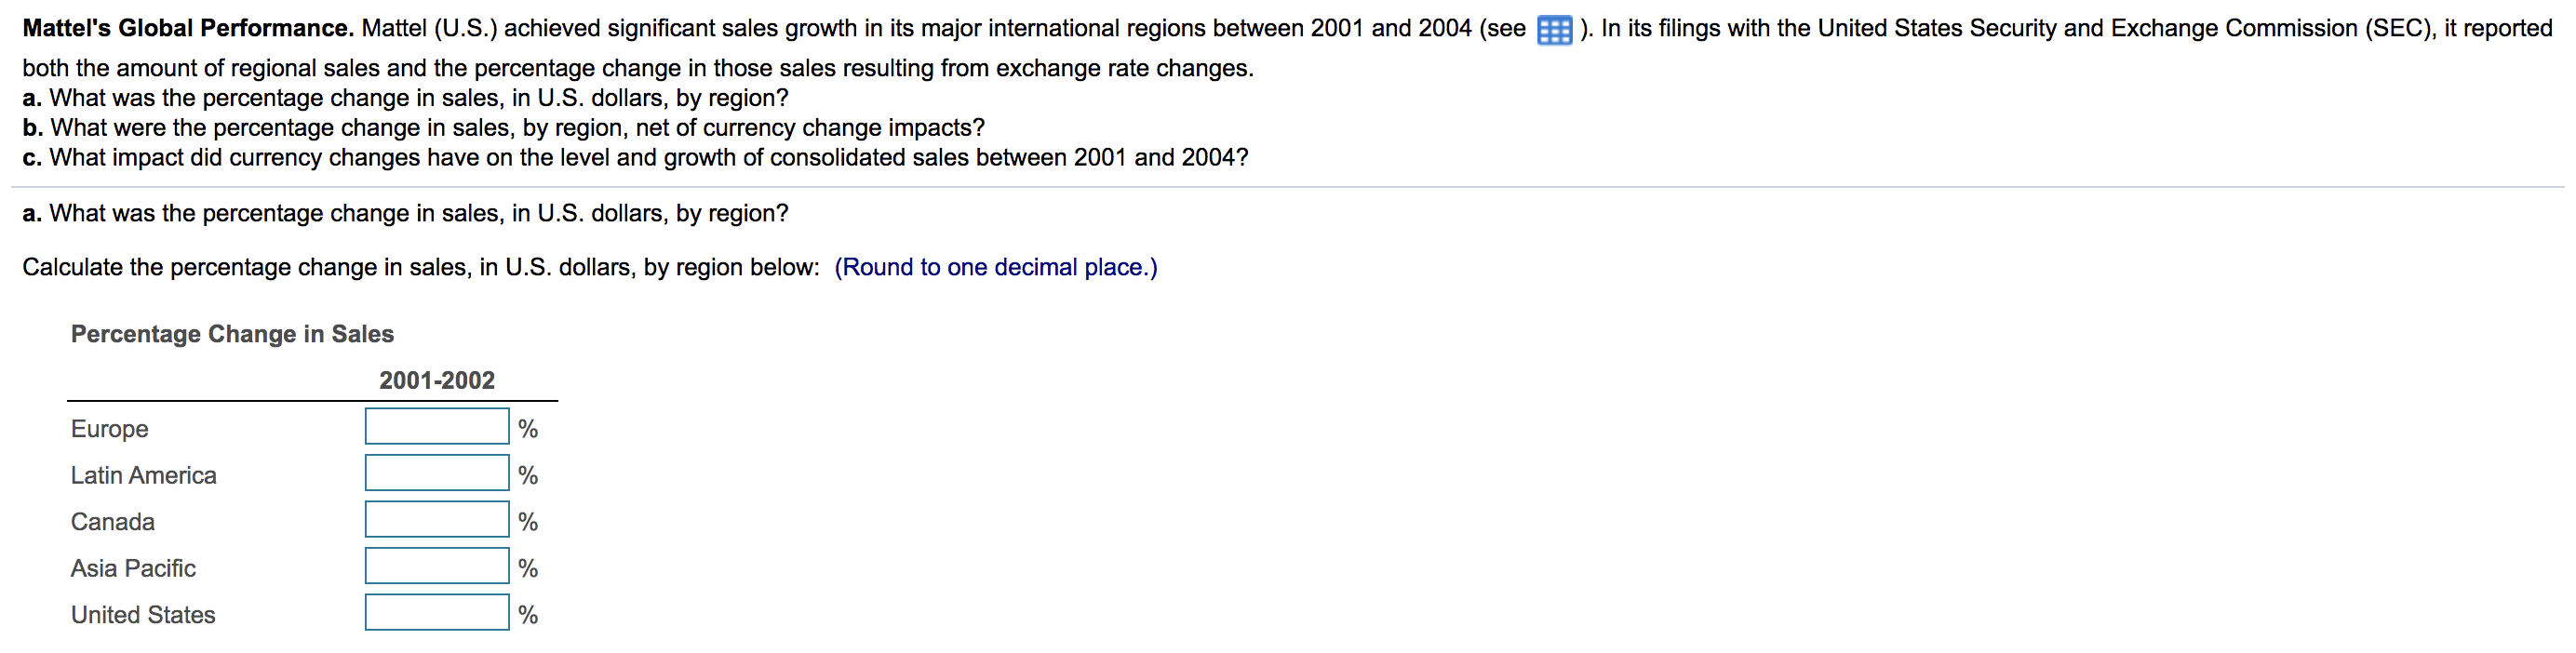
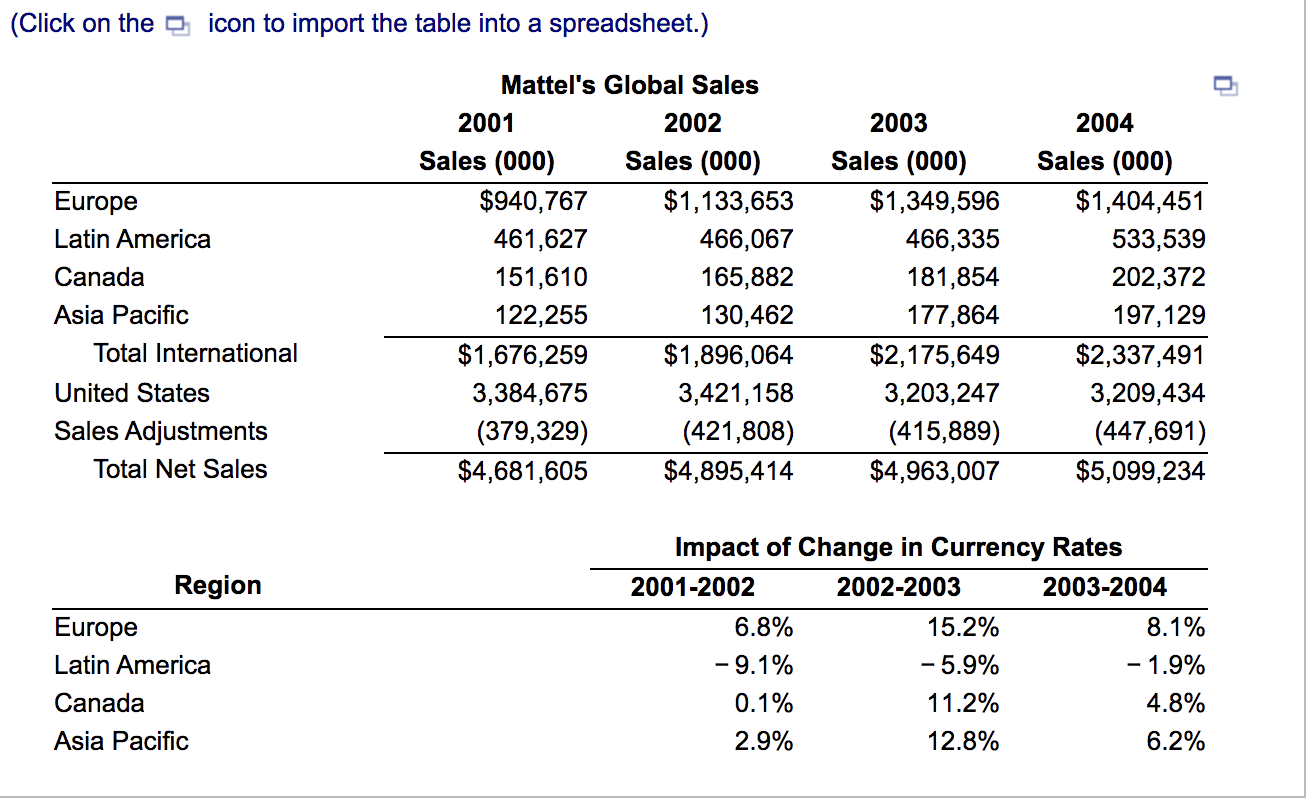
Mattel's Global Performance. Mattel (U.S.) achieved significant sales growth in its major international regions between 2001 and 2004 (see 5). In its filings with the United States Security and Exchange Commission (SEC), it reported both the amount of regional sales and the percentage change in those sales resulting from exchange rate changes. a. What was the percentage change in sales, in U.S. dollars, by region? b. What were the percentage change in sales, by region, net of currency change impacts? c. What impact did currency changes have on the level and growth of consolidated sales between 2001 and 2004? a. What was the percentage change in sales, in U.S. dollars, by region? Calculate the percentage change in sales, in U.S. dollars, by region below: (Round to one decimal place.) Percentage Change in Sales 2001-2002 Europe % Latin America % Canada % Asia Pacific % United States % (Click on the icon to import the table into a spreadsheet.) Europe Latin America Canada Asia Pacific Total International United States Sales Adjustments Total Net Sales Mattel's Global Sales 2001 2002 Sales (000) Sales (000) $940,767 $1,133,653 461,627 466,067 151,610 165,882 122,255 130,462 $1,676,259 $1,896,064 3,384,675 3,421,158 (379,329) (421,808) $4,681,605 $4,895,414 2003 Sales (000) $1,349,596 466,335 181,854 177,864 $2,175,649 3,203,247 (415,889) $4,963,007 2004 Sales (000) $1,404,451 533,539 202,372 197,129 $2,337,491 3,209,434 (447,691) $5,099,234 Region Europe Latin America Canada Asia Pacific Impact of Change in Currency Rates 2001-2002 2002-2003 2003-2004 6.8% 15.2% 8.1% -9.1% -5.9% -1.9% 0.1% 11.2% 4.8% 2.9% 12.8% 6.2% Mattel's Global Performance. Mattel (U.S.) achieved significant sales growth in its major international regions between 2001 and 2004 (see 5). In its filings with the United States Security and Exchange Commission (SEC), it reported both the amount of regional sales and the percentage change in those sales resulting from exchange rate changes. a. What was the percentage change in sales, in U.S. dollars, by region? b. What were the percentage change in sales, by region, net of currency change impacts? c. What impact did currency changes have on the level and growth of consolidated sales between 2001 and 2004? a. What was the percentage change in sales, in U.S. dollars, by region? Calculate the percentage change in sales, in U.S. dollars, by region below: (Round to one decimal place.) Percentage Change in Sales 2001-2002 Europe % Latin America % Canada % Asia Pacific % United States % (Click on the icon to import the table into a spreadsheet.) Europe Latin America Canada Asia Pacific Total International United States Sales Adjustments Total Net Sales Mattel's Global Sales 2001 2002 Sales (000) Sales (000) $940,767 $1,133,653 461,627 466,067 151,610 165,882 122,255 130,462 $1,676,259 $1,896,064 3,384,675 3,421,158 (379,329) (421,808) $4,681,605 $4,895,414 2003 Sales (000) $1,349,596 466,335 181,854 177,864 $2,175,649 3,203,247 (415,889) $4,963,007 2004 Sales (000) $1,404,451 533,539 202,372 197,129 $2,337,491 3,209,434 (447,691) $5,099,234 Region Europe Latin America Canada Asia Pacific Impact of Change in Currency Rates 2001-2002 2002-2003 2003-2004 6.8% 15.2% 8.1% -9.1% -5.9% -1.9% 0.1% 11.2% 4.8% 2.9% 12.8% 6.2%