Answered step by step
Verified Expert Solution
Question
1 Approved Answer
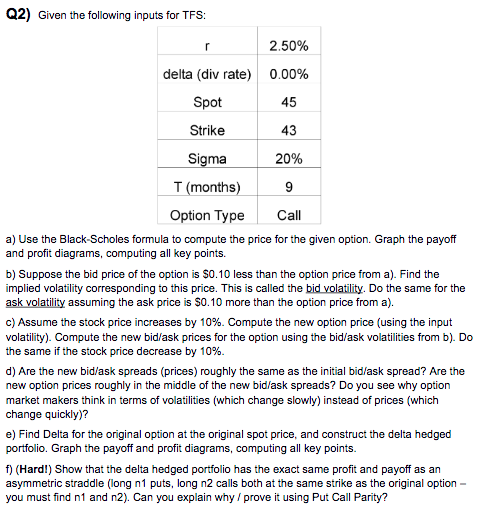
May need a spreadsheet to solve. Please solve as many as you can. Q2) Given the following inputs for TFS: 2.50% 0.00% delta (div rate)

May need a spreadsheet to solve. Please solve as many as you can.
Q2) Given the following inputs for TFS: 2.50% 0.00% delta (div rate) Spot 45 Strike 43 20% Sigma T(months) 9 Option Type Call a) Use the Black-Scholes formula to compute the price for the given option. Graph the payoff and profit diagrams, computing all key points. b) Suppose the bid price of the option is $0.10 less than the option price from a). Find the implied volatility corresponding to this price. This is called the bid volatility. Do the same for the ask volatility assuming the ask price is $0.10 more than the option price from a). c) Assume the stock price increases by 10%. Compute the new option price (using the input volatility). Compute the new bid/ask prices for the option using the bid/ask volatilities from b). Do the same if the stock price decrease by 10% d) Are the new bid/ask spreads (prices) roughly the same as the initial bid/ask spread? Are the new option prices roughly in the middle of the new bid/ask spreads? Do you see why option market makers think in terms of volatilities (which change slowly) instead of prices (which change quickly)? e) Find Delta for the original option at the original spot price, and construct the delta hedged portfolio. Graph the payoff and profit diagrams, computing all key points. 1) (Hard!) Show that the delta hedged portfolio has the exact same profit and payoff as an asymmetric straddle (long n1 puts, long n2 calls both at the same strike as the original option - you must find ni and n2). Can you explain why / prove it using Put Call Parity? Q2) Given the following inputs for TFS: 2.50% 0.00% delta (div rate) Spot 45 Strike 43 20% Sigma T(months) 9 Option Type Call a) Use the Black-Scholes formula to compute the price for the given option. Graph the payoff and profit diagrams, computing all key points. b) Suppose the bid price of the option is $0.10 less than the option price from a). Find the implied volatility corresponding to this price. This is called the bid volatility. Do the same for the ask volatility assuming the ask price is $0.10 more than the option price from a). c) Assume the stock price increases by 10%. Compute the new option price (using the input volatility). Compute the new bid/ask prices for the option using the bid/ask volatilities from b). Do the same if the stock price decrease by 10% d) Are the new bid/ask spreads (prices) roughly the same as the initial bid/ask spread? Are the new option prices roughly in the middle of the new bid/ask spreads? Do you see why option market makers think in terms of volatilities (which change slowly) instead of prices (which change quickly)? e) Find Delta for the original option at the original spot price, and construct the delta hedged portfolio. Graph the payoff and profit diagrams, computing all key points. 1) (Hard!) Show that the delta hedged portfolio has the exact same profit and payoff as an asymmetric straddle (long n1 puts, long n2 calls both at the same strike as the original option - you must find ni and n2). Can you explain why / prove it using Put Call ParityStep by Step Solution
There are 3 Steps involved in it
Step: 1

Get Instant Access to Expert-Tailored Solutions
See step-by-step solutions with expert insights and AI powered tools for academic success
Step: 2

Step: 3

Ace Your Homework with AI
Get the answers you need in no time with our AI-driven, step-by-step assistance
Get Started


