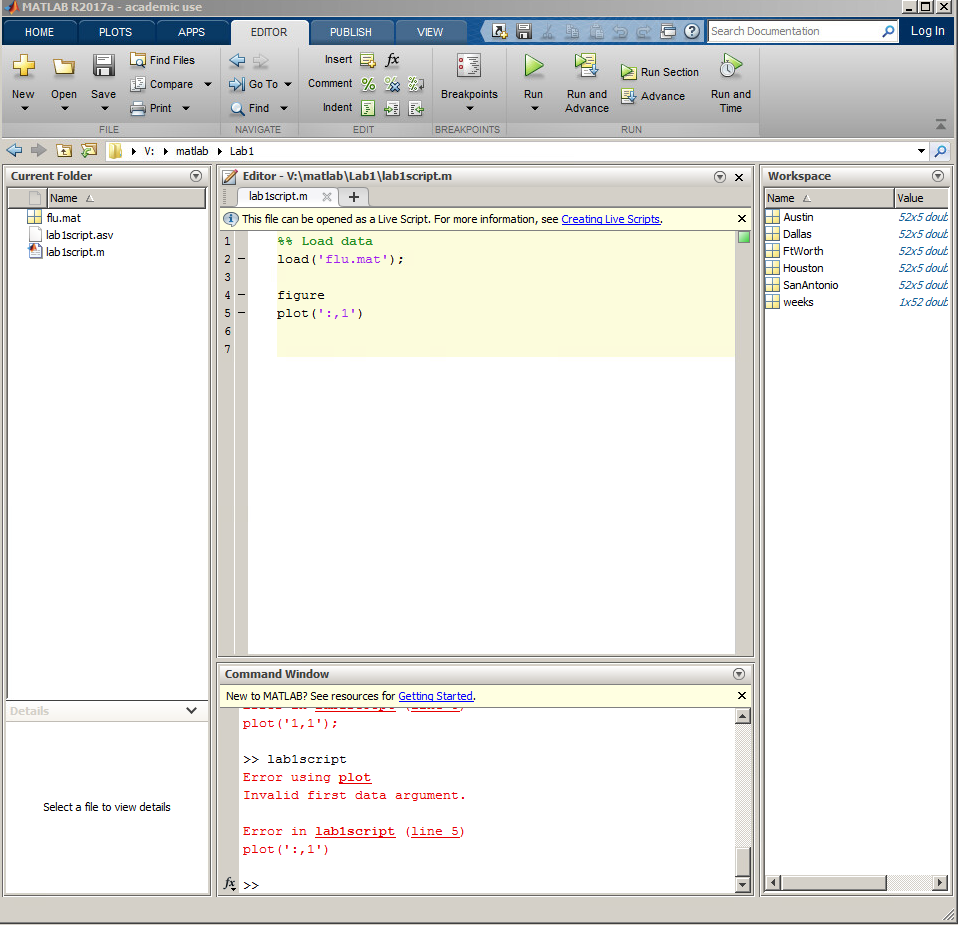
May someone help me start this code on parts II,III,IV,V. I am very new to this. The program is called MATLAB.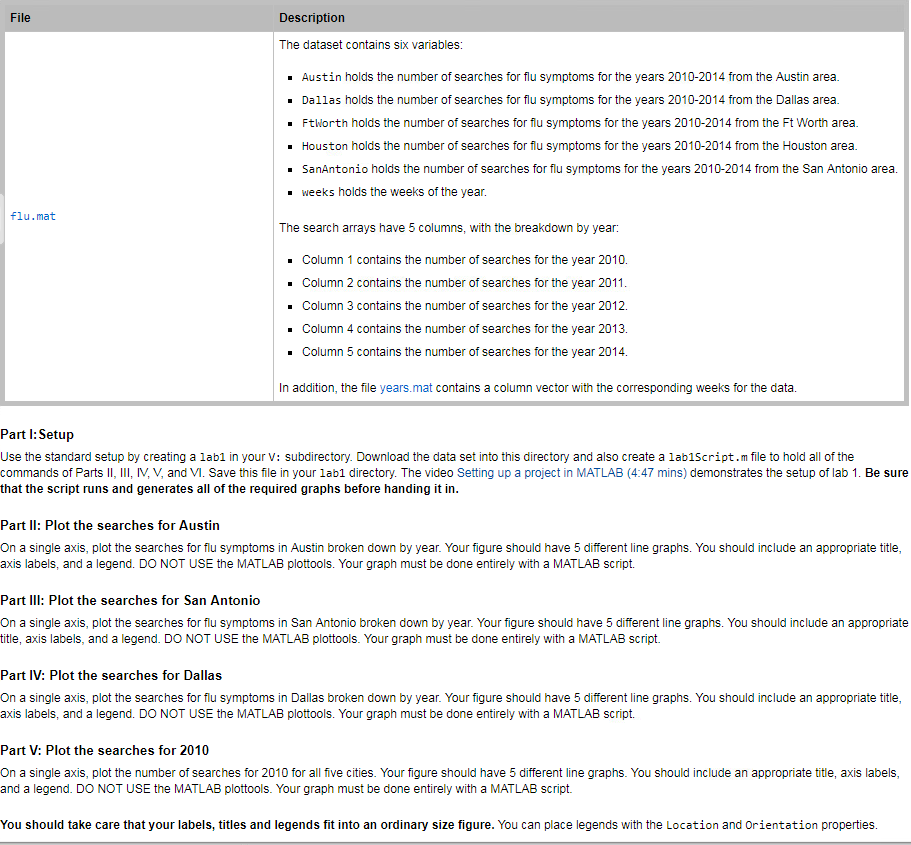
File Description The dataset contains six variables: . Austin holds the number of searches for flu symptoms for the years 2010-2014 from the Austin area . Dallas holds the number of searches for flu symptoms for the years 2010-2014 from the Dallas area FtNorth holds the number of searches for flu symptoms for the years 2010-2014 from the Ft Worth area . Houston holds the number of searches for filu symptoms for the years 2010-2014 from the Houston area . SanAntonio holds the number of searches for flu symptoms for the years 2010-2014 from the San Antonio area . weeks holds the weeks of the year. u. ma The search arrays have 5 columns, with the breakdown by year Column 1 contains the number of searches for the year 2010. Column 2 contains the number of searches for the year 2011 Column 3 contains the number of searches for the year 2012. Column 4 contains the number of searches for the year 2013. Column 5 contains the number of searches for the year 2014 . . . . . In addition, the file years.mat contains a column vector with the corresponding weeks for the data Part l: Setup Use the standard setup by creating a lab1 in your V: subdirectory. Download the data set into this directory and also create a lab1Script.m file to hold all of the commands of Parts I, II, IV, V, and VI. Save this file in your lab1 directory. The video Setting up a project in MATLAB (4:47 mins) demonstrates the setup of lab 1. Be sure that the script runs and generates all of the required graphs before handing it in Part II: Plot the searches for Austin On a single axis, plot the searches for flu symptoms in Austin broken down by year. Your figure shoud have 5 different line graphs. You should include an appropriate title axis labels, and a legend. DO NOT USE the MATLAB plottools. Your graph must be done entirely with a MATLAB script. Part III: Plot the searches for San Antonio On a single axis, plot the searches for flu symptoms in San Antonio broken down by year. Your figure should have 5 different line graphs. You should include an appropriate title, axis labels, and a legend. DO NOT USE the MATLAB plottools. Your graph must be done entirely with a MATLAB script. Part IV: Plot the searches for Dallas On a single axis, plot the searches for flu symptoms in Dallas broken down by year. Your figure should have 5 different line graphs. You should include an appropriate title axis labels, and a legend. DO NOT USE the MATLAB plottools. Your graph must be done entirely with a MATLAB script. Part V: Plot the searches for 2010 On a single axis, plot the number of searches for 2010 for all five cities. Your figure should have 5 different line graphs. You should include an appropriate title, axis labels and a legend. DO NOT USE the MATLAB plottools. Your graph must be done entirely with a MATLAB script. You should take care that your labels, titles and legends fit into an ordinary size figure. You can place legends with the Location and Orientation properties. File Description The dataset contains six variables: . Austin holds the number of searches for flu symptoms for the years 2010-2014 from the Austin area . Dallas holds the number of searches for flu symptoms for the years 2010-2014 from the Dallas area FtNorth holds the number of searches for flu symptoms for the years 2010-2014 from the Ft Worth area . Houston holds the number of searches for filu symptoms for the years 2010-2014 from the Houston area . SanAntonio holds the number of searches for flu symptoms for the years 2010-2014 from the San Antonio area . weeks holds the weeks of the year. u. ma The search arrays have 5 columns, with the breakdown by year Column 1 contains the number of searches for the year 2010. Column 2 contains the number of searches for the year 2011 Column 3 contains the number of searches for the year 2012. Column 4 contains the number of searches for the year 2013. Column 5 contains the number of searches for the year 2014 . . . . . In addition, the file years.mat contains a column vector with the corresponding weeks for the data Part l: Setup Use the standard setup by creating a lab1 in your V: subdirectory. Download the data set into this directory and also create a lab1Script.m file to hold all of the commands of Parts I, II, IV, V, and VI. Save this file in your lab1 directory. The video Setting up a project in MATLAB (4:47 mins) demonstrates the setup of lab 1. Be sure that the script runs and generates all of the required graphs before handing it in Part II: Plot the searches for Austin On a single axis, plot the searches for flu symptoms in Austin broken down by year. Your figure shoud have 5 different line graphs. You should include an appropriate title axis labels, and a legend. DO NOT USE the MATLAB plottools. Your graph must be done entirely with a MATLAB script. Part III: Plot the searches for San Antonio On a single axis, plot the searches for flu symptoms in San Antonio broken down by year. Your figure should have 5 different line graphs. You should include an appropriate title, axis labels, and a legend. DO NOT USE the MATLAB plottools. Your graph must be done entirely with a MATLAB script. Part IV: Plot the searches for Dallas On a single axis, plot the searches for flu symptoms in Dallas broken down by year. Your figure should have 5 different line graphs. You should include an appropriate title axis labels, and a legend. DO NOT USE the MATLAB plottools. Your graph must be done entirely with a MATLAB script. Part V: Plot the searches for 2010 On a single axis, plot the number of searches for 2010 for all five cities. Your figure should have 5 different line graphs. You should include an appropriate title, axis labels and a legend. DO NOT USE the MATLAB plottools. Your graph must be done entirely with a MATLAB script. You should take care that your labels, titles and legends fit into an ordinary size figure. You can place legends with the Location and Orientation properties