Mean entry-level salaries for college graduates with mechanical en ering degrees are believed to be approximately the same. A recruiting office thinks that the mean
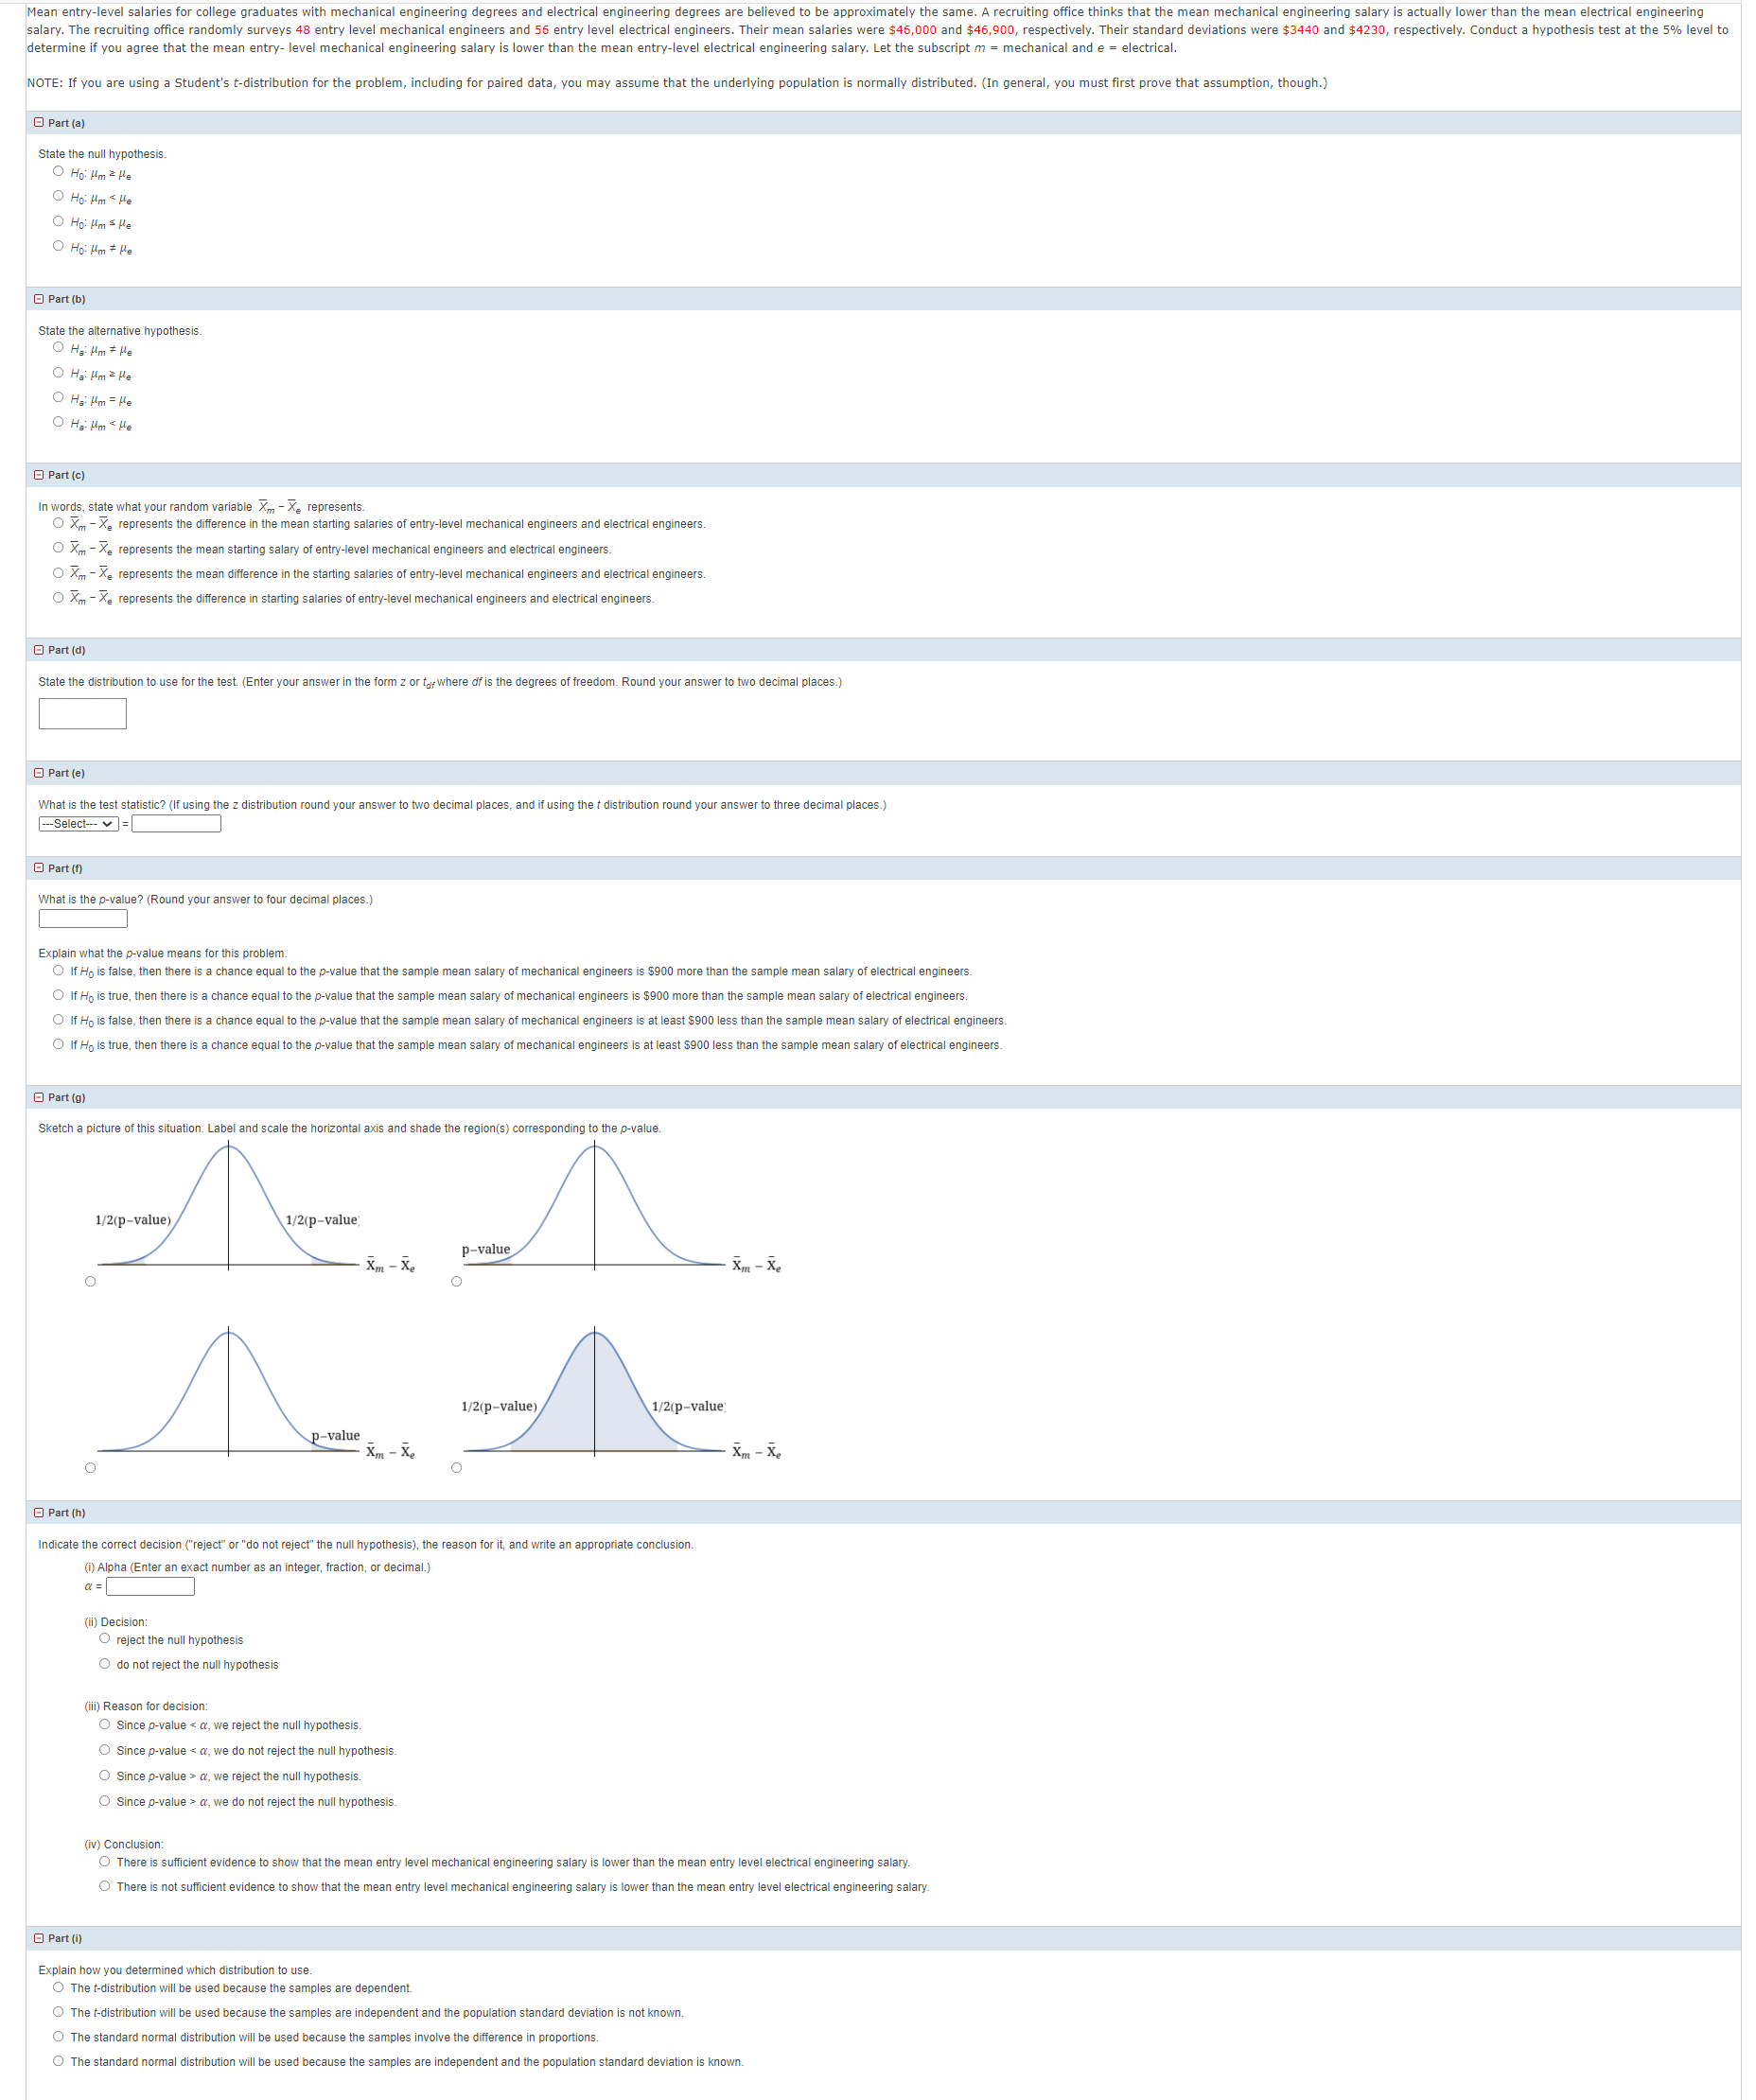
Mean entry-level salaries for college graduates with mechanical en ering degrees are believed to be approximately the same. A recruiting office thinks that the mean mechanical engineering salary is actually lower than the mean electrical engineering nly surveys 48 entry level mechanical engineers and 56 entry level electrical engineers. Their mean salaries were $46,000 and $46,900, respectively. Their standard deviations were $3440 and $4230, respectively. Conduct a hypothesis test at the 5% level to determine if you agree that the mean entry- level mechanical engineering salary is lower than the mean entry-level electrical engineering salary. Let the subscript m = mechanical and e = electrical. NOTE: If you are using a Student's t-distribution for the problem, including for paired data, you may assume that the underlying population is normally distributed. (In general, you must first prove that assumption, though.) Part (a ) State the null hypothesis. O Ho. Hm z He O Ho : Hm He O Ho : Hm S He O HO : Hm * He part (b ) State the alternative hypothesis O He Hm # He O H s . Hm z He O Hs : Hm = He O Hai Hm He Part (c) In words, state what your random variable Xm - Xe represents. O Xm - Xe represents the difference in the mean starting salaries of hanical engineers and electrical engineers . O Xm - Xe represents the mean starting salary of entry-level mecha eers and electrical engineers. O Xm - Xe represents the mean difference in the starting salaries of entry-level mechanical engineers and electrical engineers. O Xm - Xe represents the difference in starti gineers and electrical engineers. Part (d State the distribution to use for the test. (Enter your answer in the form z or tay where of is the degrees of freedom. Round your answer to two decimal places.) Part (e) What is the test statistic? (If using the z distribution round your answer to two decimal places, and if using the t distribution round your answer to three decimal places.) -Select-. = Part (f) What is the p-value? (Round your answer to four decimal places.) Explain what the p-value means for this problem. O If Ho is false, then there is a chance equal to the p-va sample mean salary of electrical engineers O If Ho is true, then there is a chance equal to the an the sample mean salary of electrical engineers. O If Ho is false, then there is a chance ss than the sample mean salary of electrical engineers. O If Ho is true, then there is a chance equa at least $900 less than the sample mean salary of electrical engineers. Part (9 Sketch a picture of this situation. Label and scale the horizontal axis and shade the region(s) corresponding to the p-value. 1/2 (p-value 2(p-value: p-value Xm - Xe Xm - X 1/2 (p-value) 1/2(p-value: p-value _ - Xm - Xe X m - Xe Part (h Indicate the correct decision ("reject" or "do not reject" the null hypothesis), the reason for it, and write an appropriate conclusion. (1) Alpha (Enter an exact number as an integer, fraction, or decimal.) a = (i) Decision: O reject the null hypothesis O do not reject the null hypothesis (ifi) Reason for decision: O Since p-value a, we reject the null hypothesis. O Since p-value > a, we do not reject the null hypothesis. (iv) Conclusion: There is sufficient evidence to show that the mean entry level me el electrical engineering salary. There is not sufficient evidence to show that the mean entry level mechanical engineering salary is lower than the mean entry level electrical engineering salary. Part (i) Explain how you determined which distribution to use. O The t-distribution will be used because the samples are dependent. O The t-distribution will be used re independent and the population standard deviation is not known. The standard normal distribution will be used be ed because the samples involve the difference in proportions. O The standar and the population standard deviation is known
Step by Step Solution
There are 3 Steps involved in it
Step: 1
Get Instant Access to Expert-Tailored Solutions
See step-by-step solutions with expert insights and AI powered tools for academic success
Step: 2
Step: 3
Ace Your Homework with AI
Get the answers you need in no time with our AI-driven, step-by-step assistance