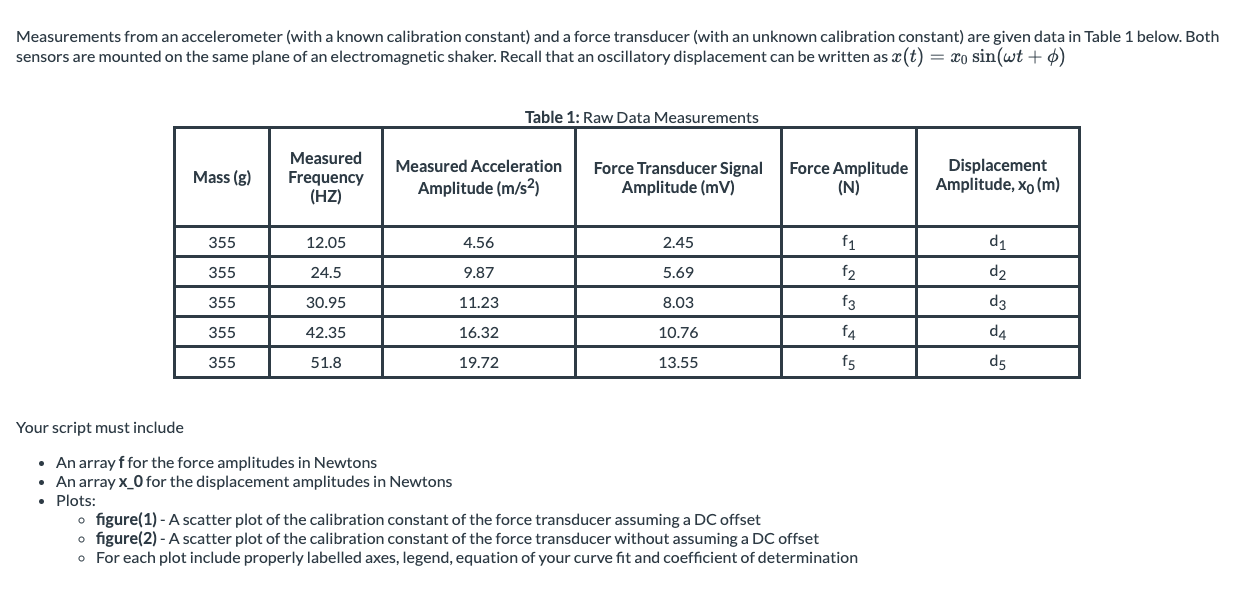
Measurements from an accelerometer (with a known calibration constant) and a force transducer (with an unknown calibration constant) are given data in Table 1 below. Both sensors are mounted on the same plane of an electromagnetic shaker. Recall that an oscillatory displacement can be written as x(t) = xo sin(wt +0) Table 1: Raw Data Measurements Mass (g) Measured Frequency (HZ) Measured Acceleration Amplitude (m/s) Force Transducer Signal Amplitude (mV) Force Amplitude (N) Displacement Amplitude, Xo (m) 355 12.05 4.56 2.45 f1 d1 355 24.5 9.87 5.69 d2 f2 f3 355 30.95 11.23 8.03 d3 355 42.35 16.32 10.76 f4 d4 355 51.8 19.72 13.55 f5 d5 Your script must include An array f for the force amplitudes in Newtons An array x_0 for the displacement amplitudes in Newtons Plots: o figure(1) - A scatter plot of the calibration constant of the force transducer assuming a DC offset o figure(2) - A scatter plot of the calibration constant of the force transducer without assuming a DC offset . For each plot include properly labelled axes, legend, equation of your curve fit and coefficient of determination Measurements from an accelerometer (with a known calibration constant) and a force transducer (with an unknown calibration constant) are given data in Table 1 below. Both sensors are mounted on the same plane of an electromagnetic shaker. Recall that an oscillatory displacement can be written as x(t) = xo sin(wt +0) Table 1: Raw Data Measurements Mass (g) Measured Frequency (HZ) Measured Acceleration Amplitude (m/s) Force Transducer Signal Amplitude (mV) Force Amplitude (N) Displacement Amplitude, Xo (m) 355 12.05 4.56 2.45 f1 d1 355 24.5 9.87 5.69 d2 f2 f3 355 30.95 11.23 8.03 d3 355 42.35 16.32 10.76 f4 d4 355 51.8 19.72 13.55 f5 d5 Your script must include An array f for the force amplitudes in Newtons An array x_0 for the displacement amplitudes in Newtons Plots: o figure(1) - A scatter plot of the calibration constant of the force transducer assuming a DC offset o figure(2) - A scatter plot of the calibration constant of the force transducer without assuming a DC offset . For each plot include properly labelled axes, legend, equation of your curve fit and coefficient of determination


